Markets articles
How to read live crypto data, written by the people who run the pipeline behind it.
Sentiment Has Fallen for Three Sessions While Price Did Nothing. That Is the Momentum Draining Out.
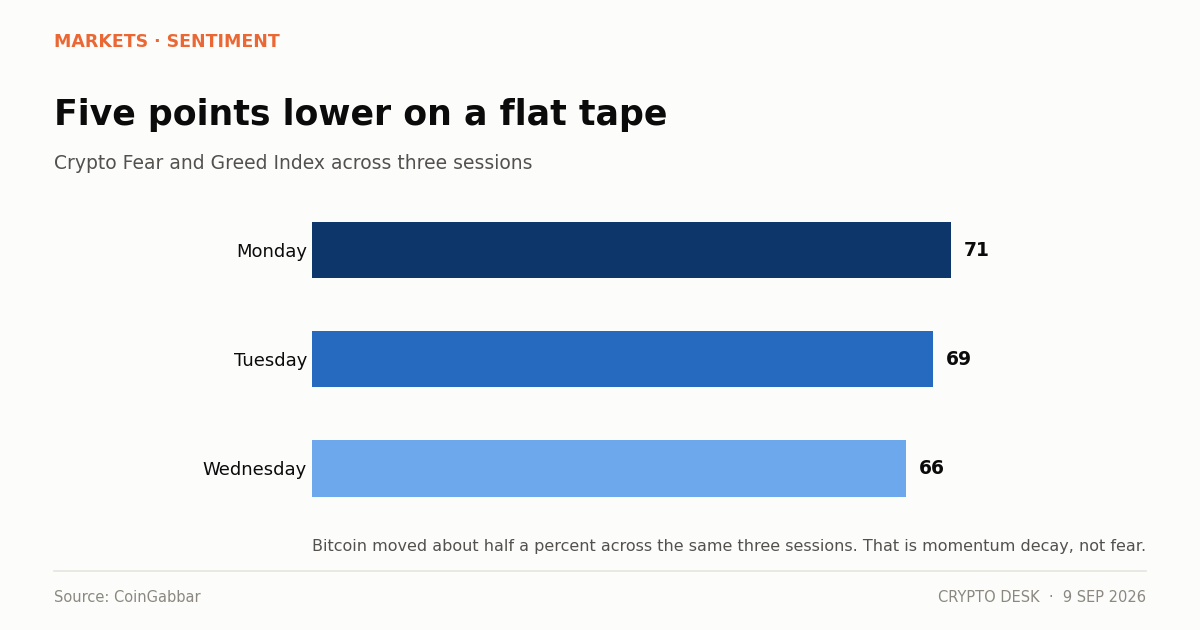
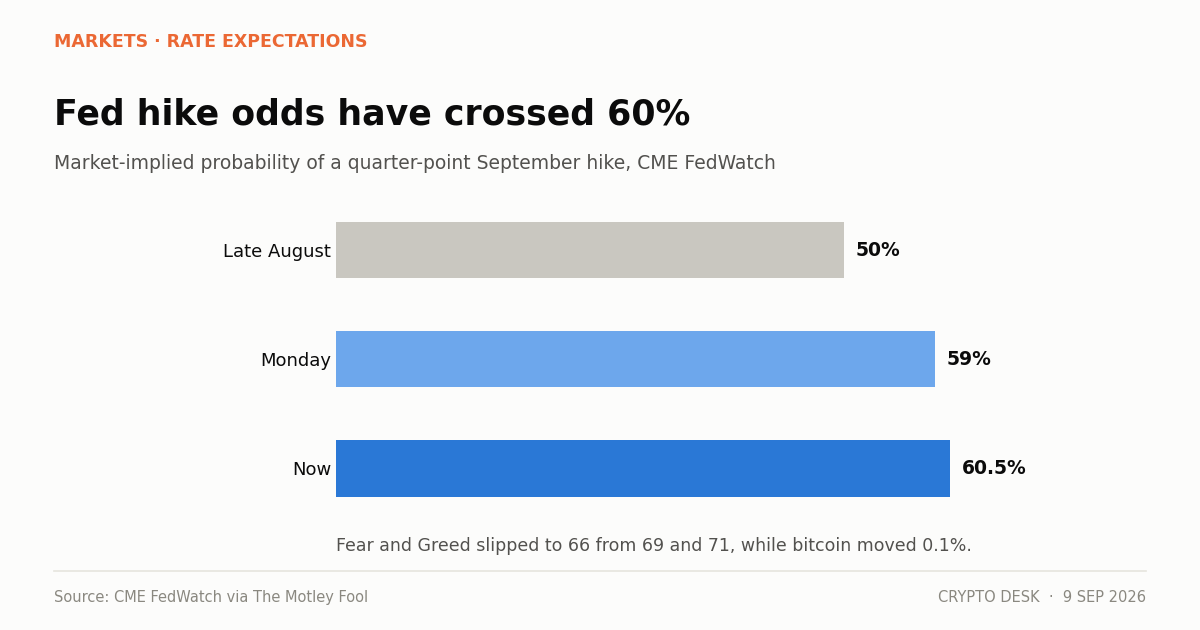
The crypto Fear and Greed Index slipped to 66 from 69 and 71 across three sessions while bitcoin barely moved, showing momentum decay rather than fear.
Stablecoins Turned Over $76 Billion in a Day on a $291 Billion Base
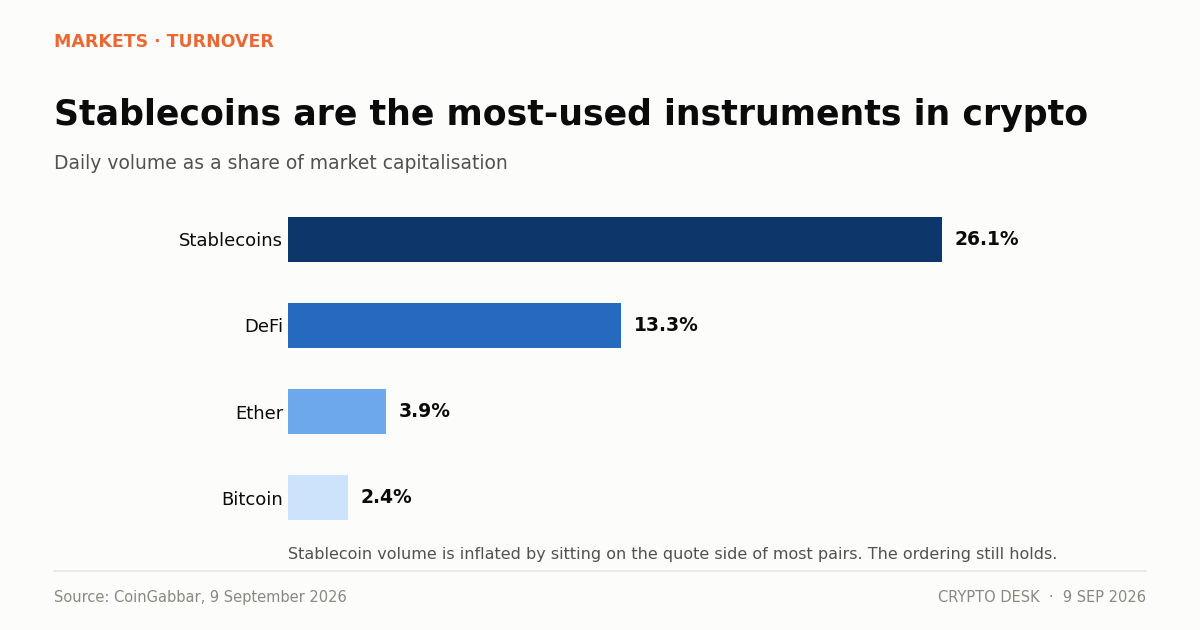
The stablecoin market cap sits at $291.3 billion with $76.11 billion of daily volume — a turnover ratio no other crypto asset comes close to.
IBIT Took $117 Million on a Friday Nobody Was Watching
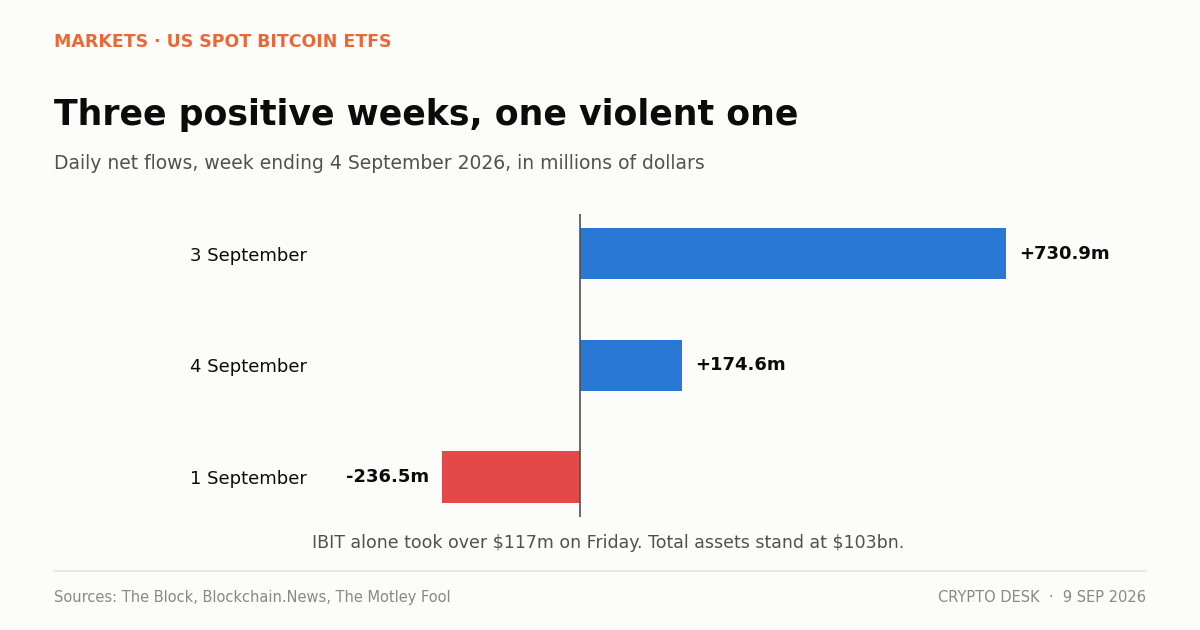
IBIT inflows of over $117 million on Friday extended a bitcoin ETF run of three consecutive positive weeks and $103 billion in total assets.
Eight Green Weeks and a Record $1.68 Billion. The XRP ETF Story Has Two Cracks in It.
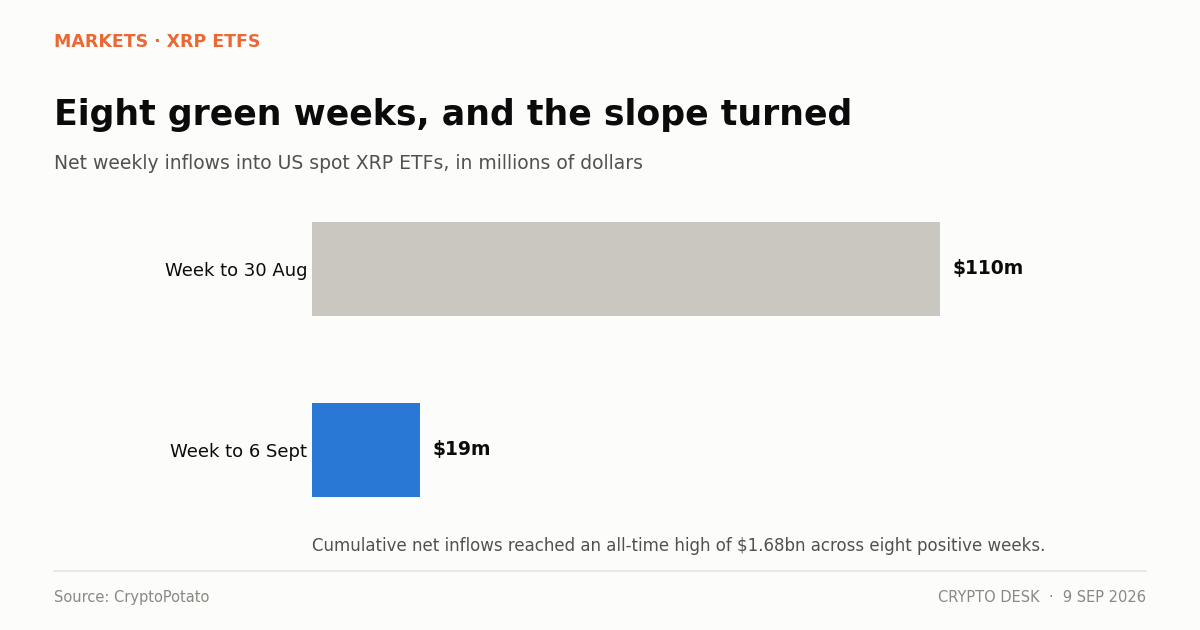
XRP ETF inflows reached a record $1.68bn cumulative across eight consecutive green weeks, but the latest week fell to $19m from $110m.
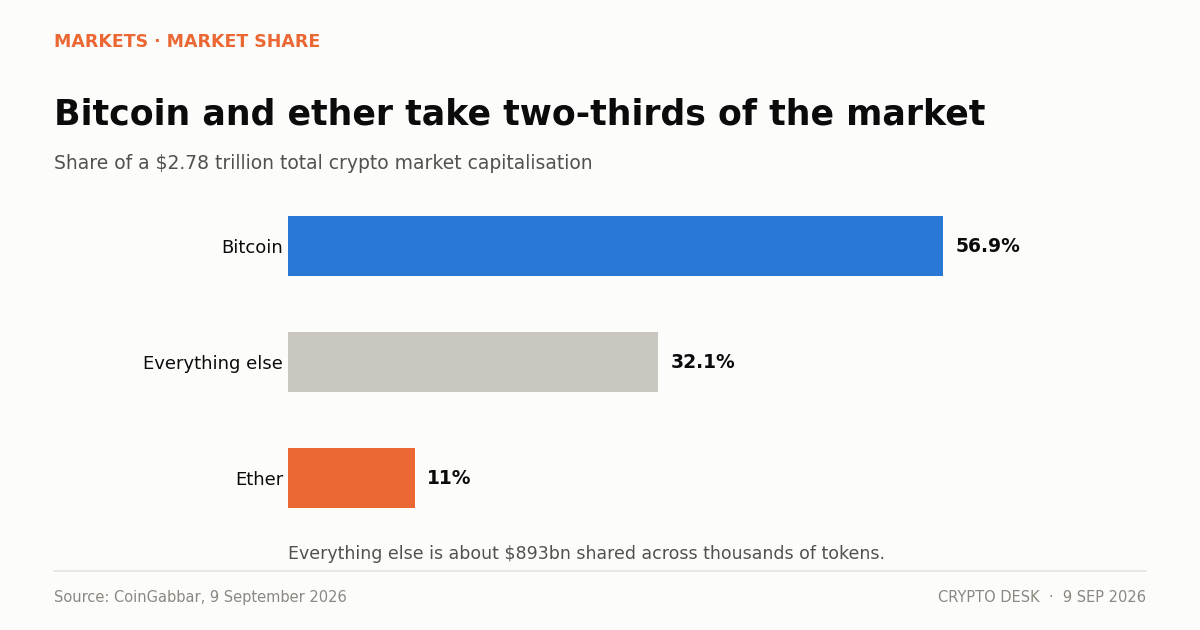
Bitcoin Dominance Is 56.9% and Ether Is 11%. Everything Else Shares What Is Left.
Bitcoin dominance stands at 56.9% and ether at 11%, leaving every other token to share the remaining 32% of a $2.78 trillion market.
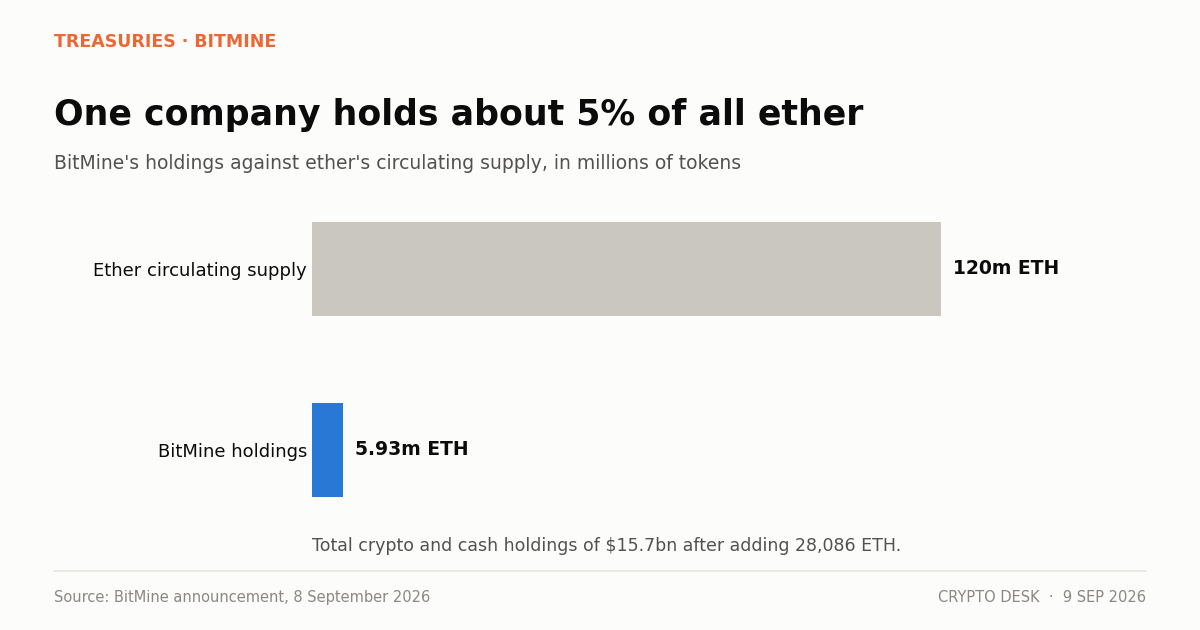
One Company Now Holds 5.93 Million Ether. That Is Roughly 5% of the Supply.
BitMine's Ethereum treasury reached 5.93 million ETH after adding 28,086 tokens, with total crypto and cash holdings of $15.7 billion.
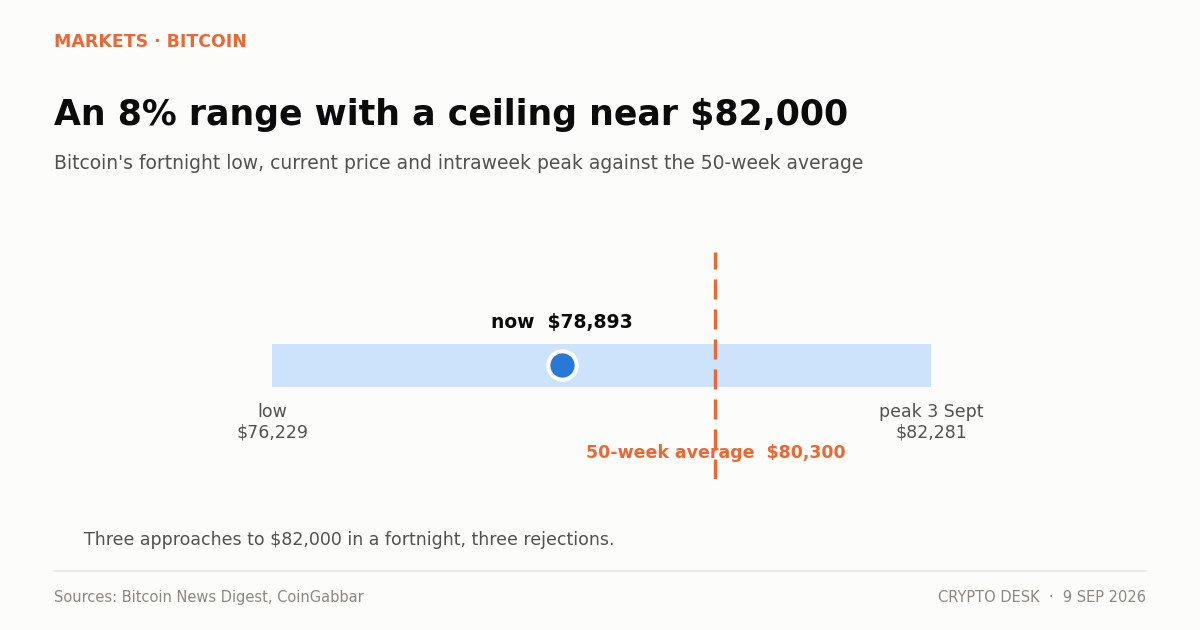
Three Attempts, One Level: Why $82,000 Keeps Turning Bitcoin Back
Bitcoin resistance at $82,000 has turned price back three times since late August, with the $80,000 level failing to hold on each retreat.
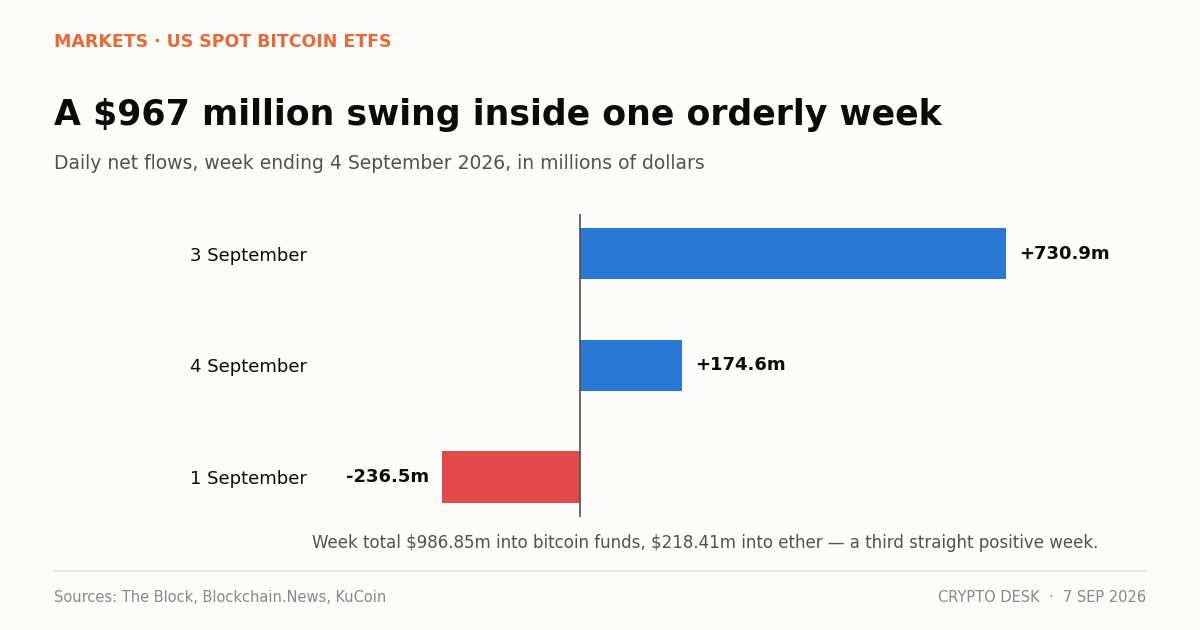
A Third Straight Week of Inflows, and the Year-to-Date Ledger Is Finally Close to Even
Bitcoin ETF weekly inflows reached $986.85m in the week to 4 September, with ether funds adding $218.41m for a combined $1.2bn and a three-week streak.
Bitcoin Is Flat, Sentiment Is Slipping, and the Rate Market Has Made Up Its Mind
Fed hike odds passed 60% on the CME FedWatch tool as bitcoin held $78,893 and the Fear and Greed Index slipped to 66 from 69.
600 Bitcoin Mined in March 2010 Just Moved. Nobody Knows Who Owns Them.
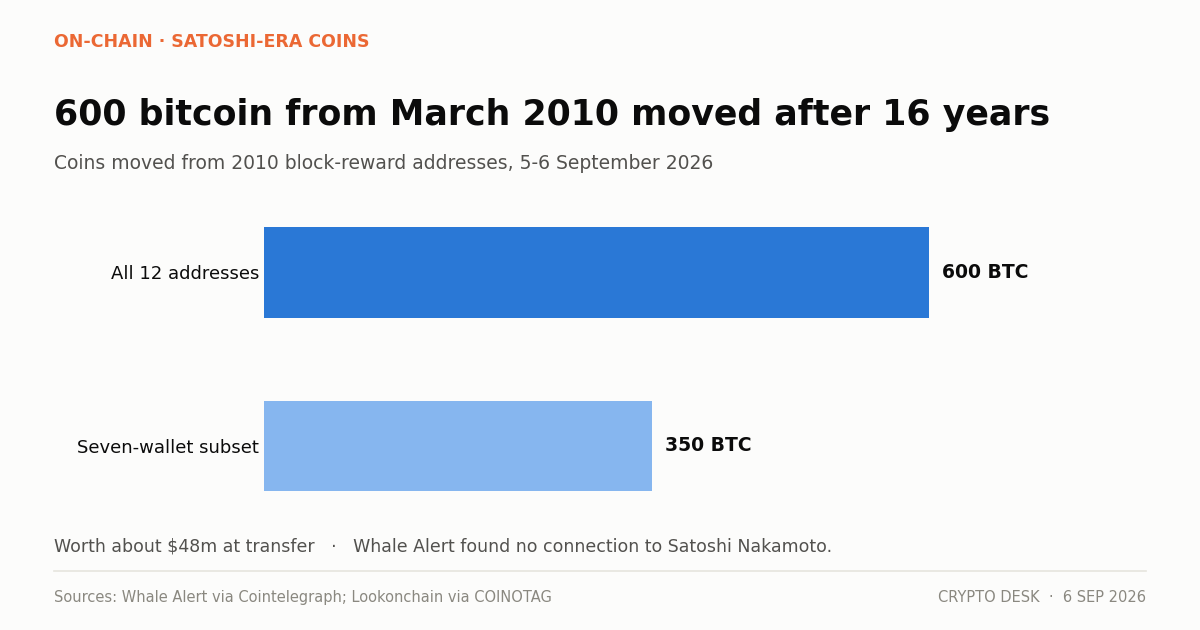
Twelve addresses holding March 2010 block rewards moved 600 BTC worth about $48m on 5-6 September. Whale Alert found no connection to Satoshi Nakamoto.
$103 Billion in Assets, and the Daily Flow Swung by a Billion Dollars in Three Sessions
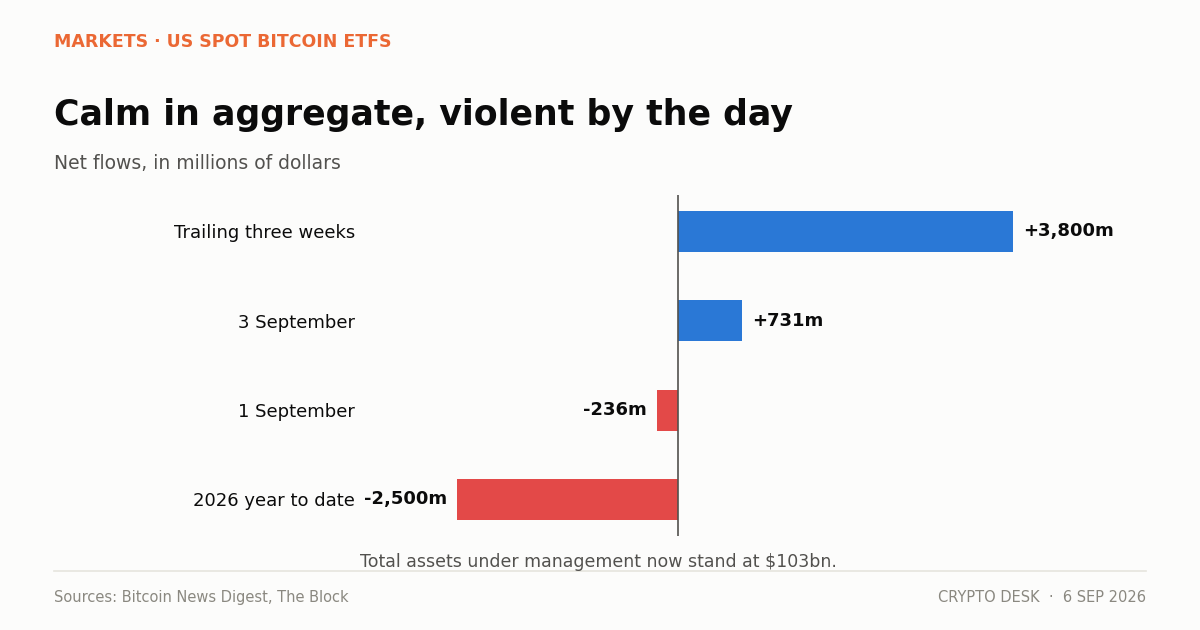
Bitcoin ETF assets under management reached $103bn after $3.8bn of three-week inflows, but daily flows swung from -$236m to +$731m within three sessions.
Bitcoin Now Tracks Gold More Closely Than Tech Stocks for the First Time Since 2020
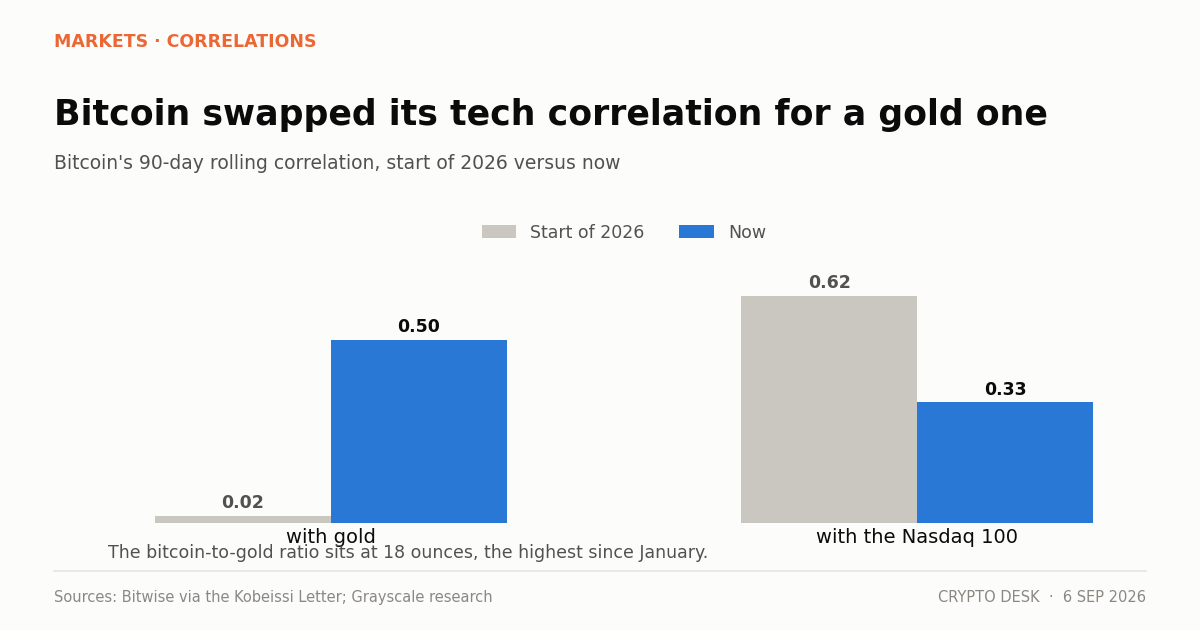
Bitcoin's 90-day correlation with gold has risen above 0.50, a six-year high, while its Nasdaq 100 correlation has fallen from over 60% to about 33%.
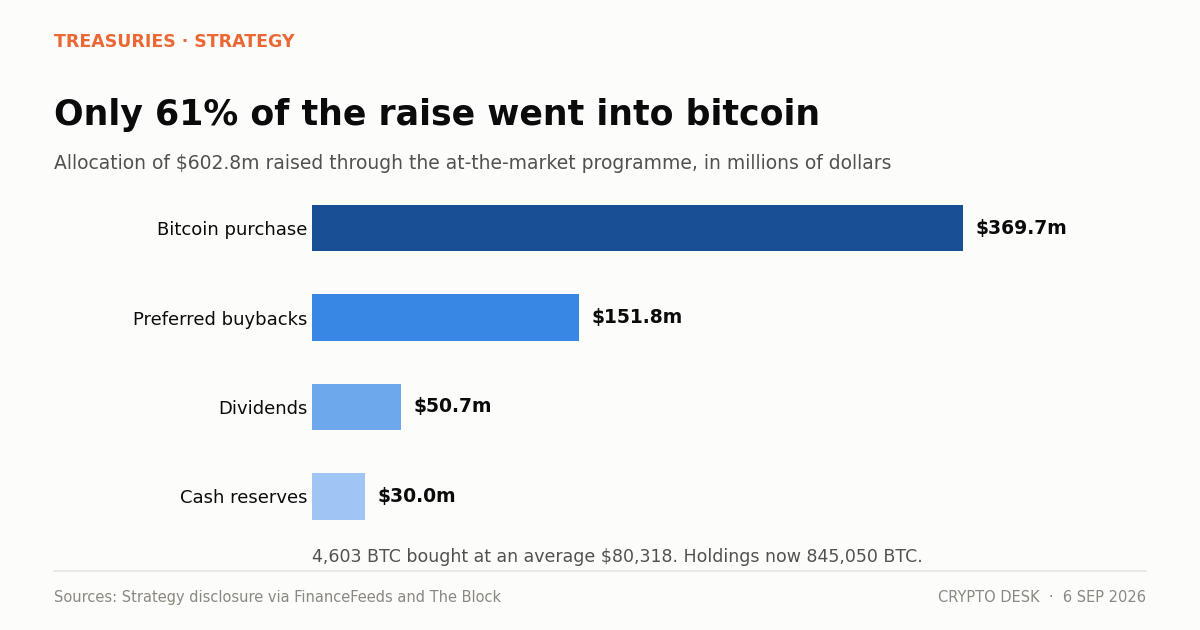
We''re Back": Strategy Buys 4,603 Bitcoin After a Ten-Week Pause, and the Tranche Is Already Underwater
Strategy bought 4,603 BTC at an average $80,318 between 24 and 30 August, lifting holdings to 845,050 BTC. The tranche is already down about $9m.
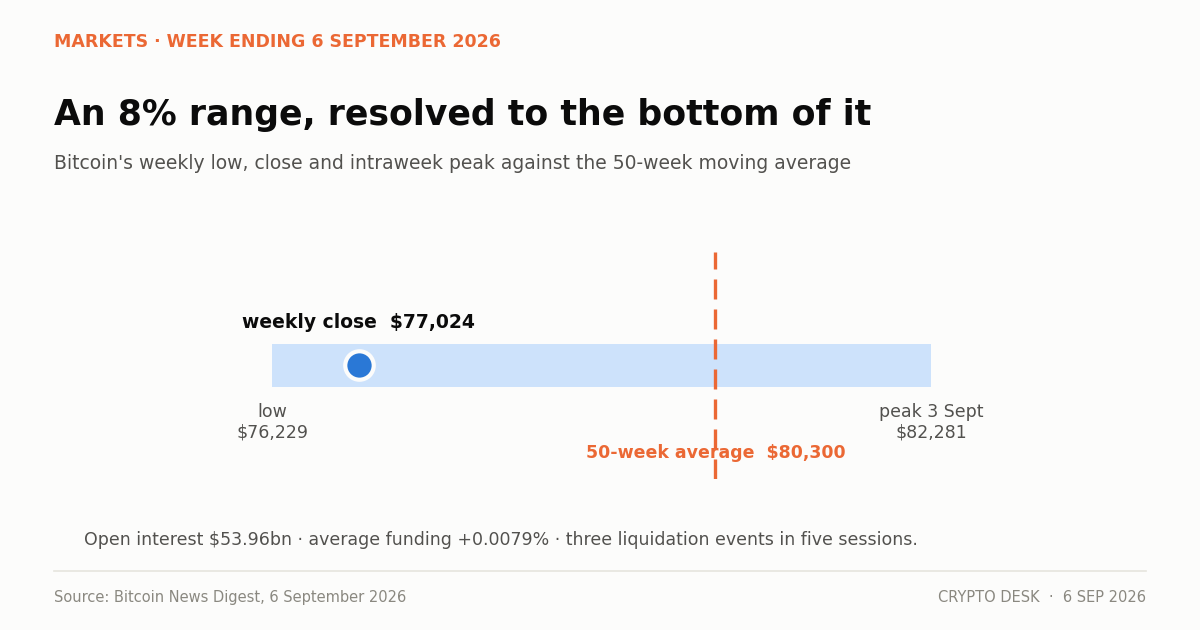
Bitcoin Touched $82,281 and Closed the Week at $77,024. The 50-Week Average Is Now Overhead.
Bitcoin peaked at $82,281 on 3 September and closed the week at $77,024, back below its 50-week moving average of $80,300 after the jobs report.
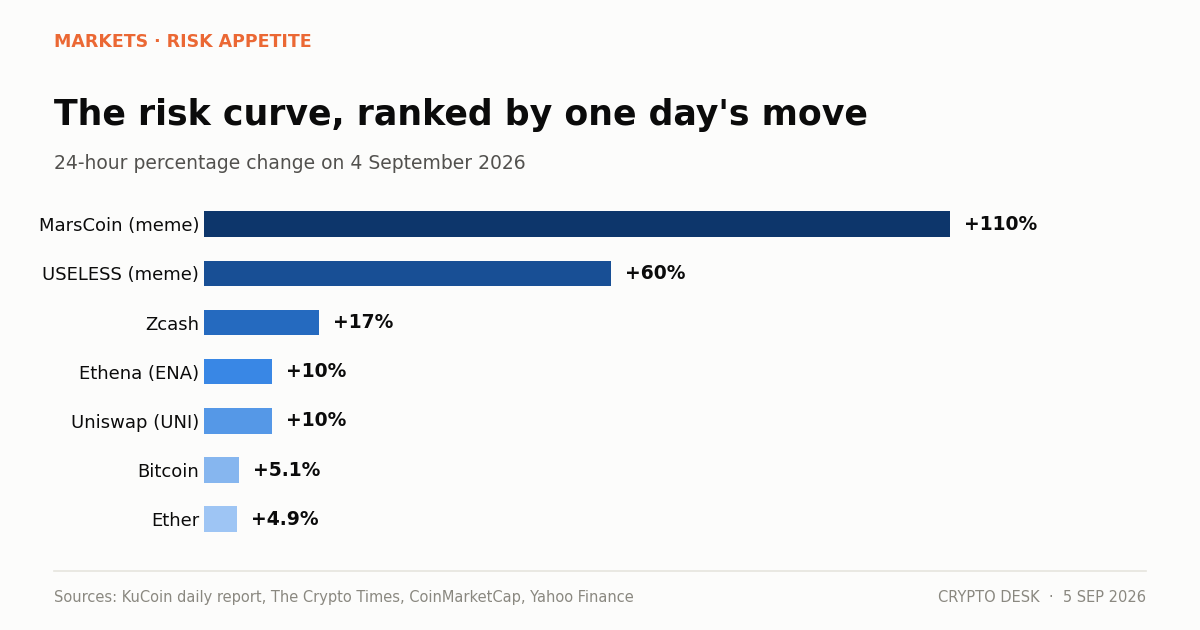
A Token Called USELESS Rose 60% and It Tells You More About This Market Than Bitcoin Did
Meme coins in September 2026 outran the majors twentyfold: USELESS rose 60% and MarsCoin 110% as a dovish Fed read pushed money out the risk curve.
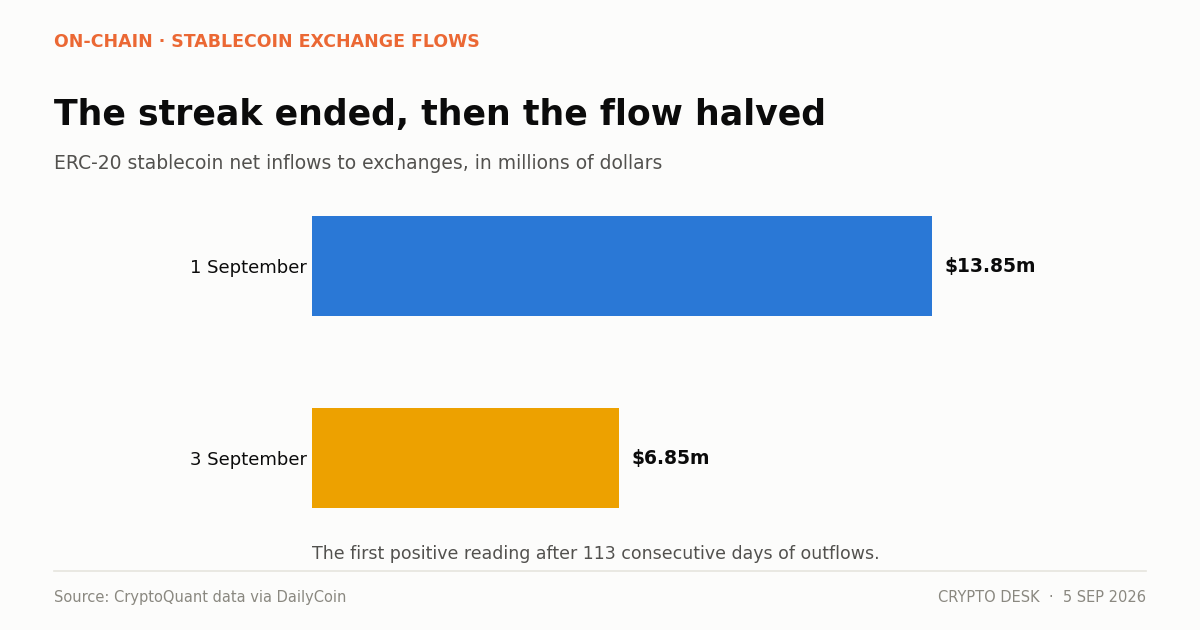
After 113 Days, Stablecoins Started Flowing Back to Exchanges. Then the Flow Halved in 48 Hours.
Stablecoin net flows to exchanges turned positive on 1 September after 113 days of outflows, but fell from $13.85m to $6.85m within two days.
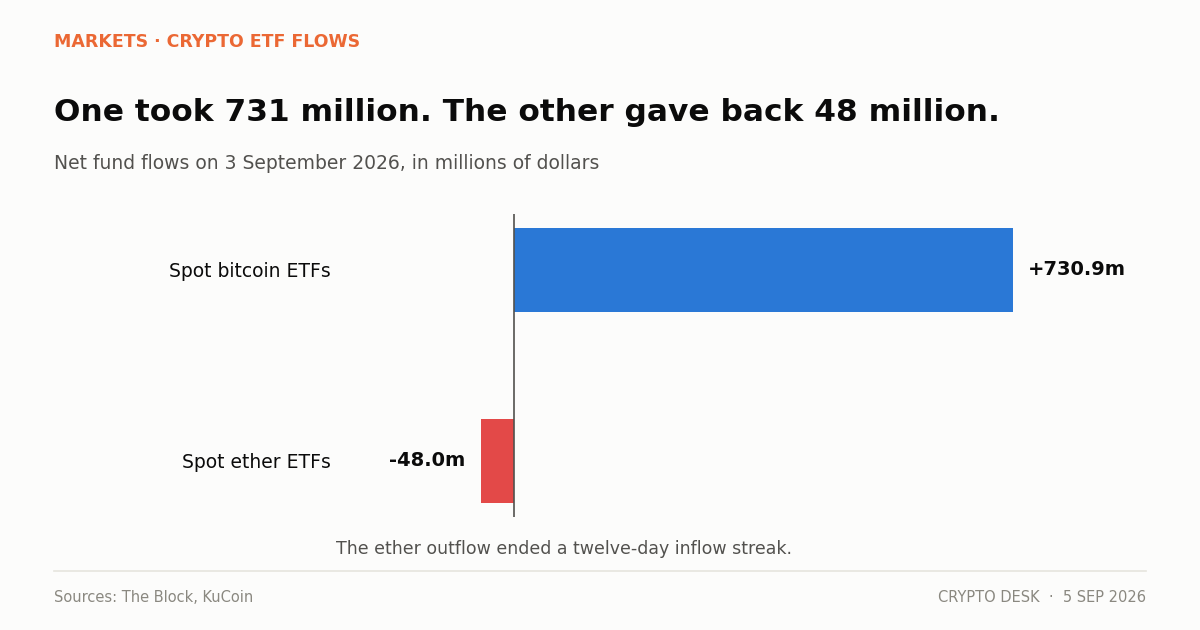
Ether ETFs Break a Twelve-Day Streak on the Day Bitcoin Funds Had Their Best Session Since January
Spot ether ETFs recorded a $48m net outflow on 3 September, ending a twelve-day inflow run, on the same day bitcoin funds took $730.9m.
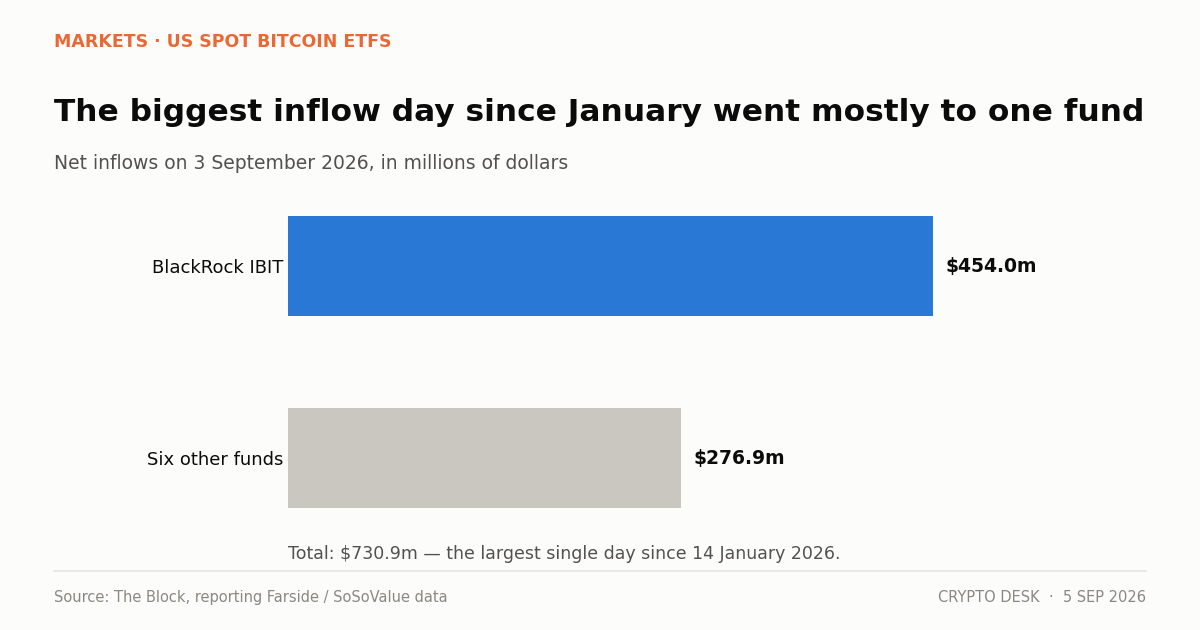
$731 Million in One Day: Bitcoin ETFs Post Their Biggest Session Since January
US spot bitcoin ETFs drew $730.9m on 3 September, the largest single day since 14 January. BlackRock's IBIT took about $454m of it.
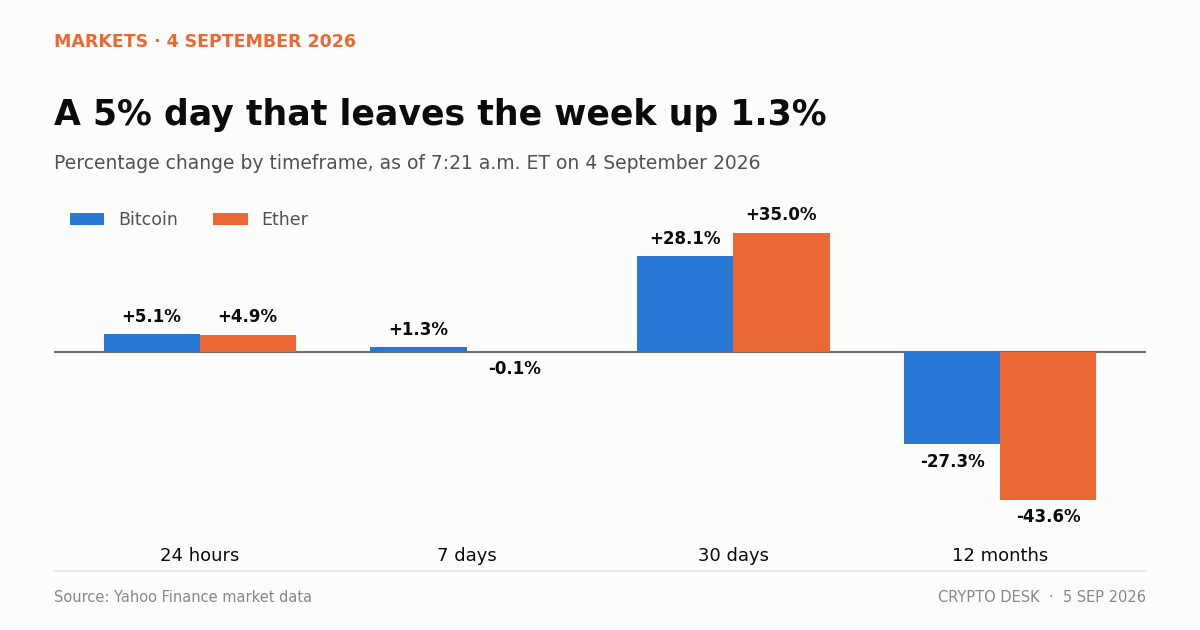
Bitcoin Reclaims $81,000 in Its Best Day Since Spring, and Short Sellers Paid for It
Bitcoin jumped about 5% to $81,240 on 4 September after Fed Governor Waller's remarks, with more than $400m of short positions liquidated in 24 hours.
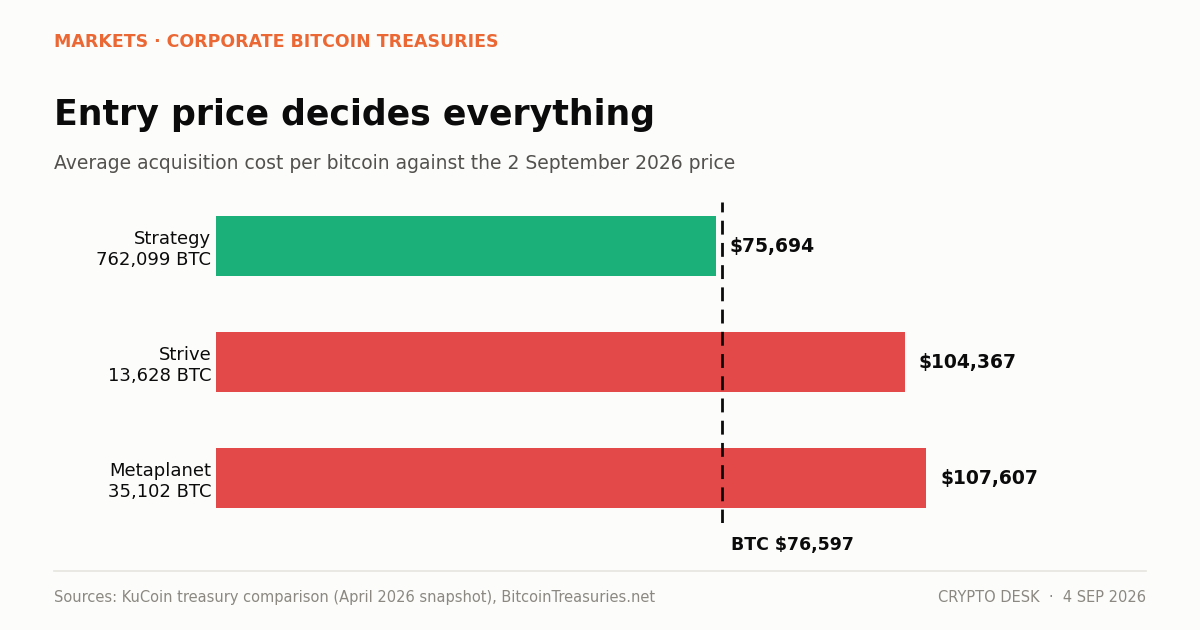
Ten Companies Hold Nearly a Million Bitcoin. Their Cost Bases Tell Very Different Stories.
The ten largest corporate bitcoin holders own about 992,000 BTC. At $76,597 Strategy is near breakeven while Metaplanet sits roughly 29% underwater.
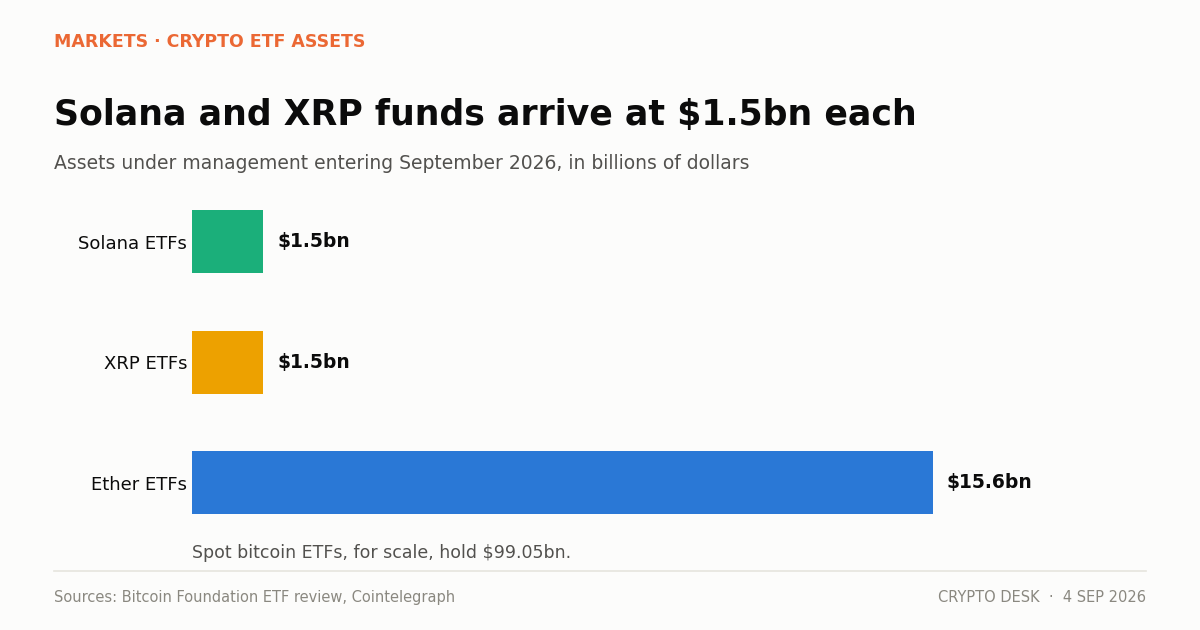
Solana and XRP ETFs Both Near $1.5 Billion. The Altcoin Fund Era Is No Longer Theoretical.
Solana ETFs neared $1.5bn in assets and XRP funds matched them entering September 2026, with one XRP product alone passing $500m.
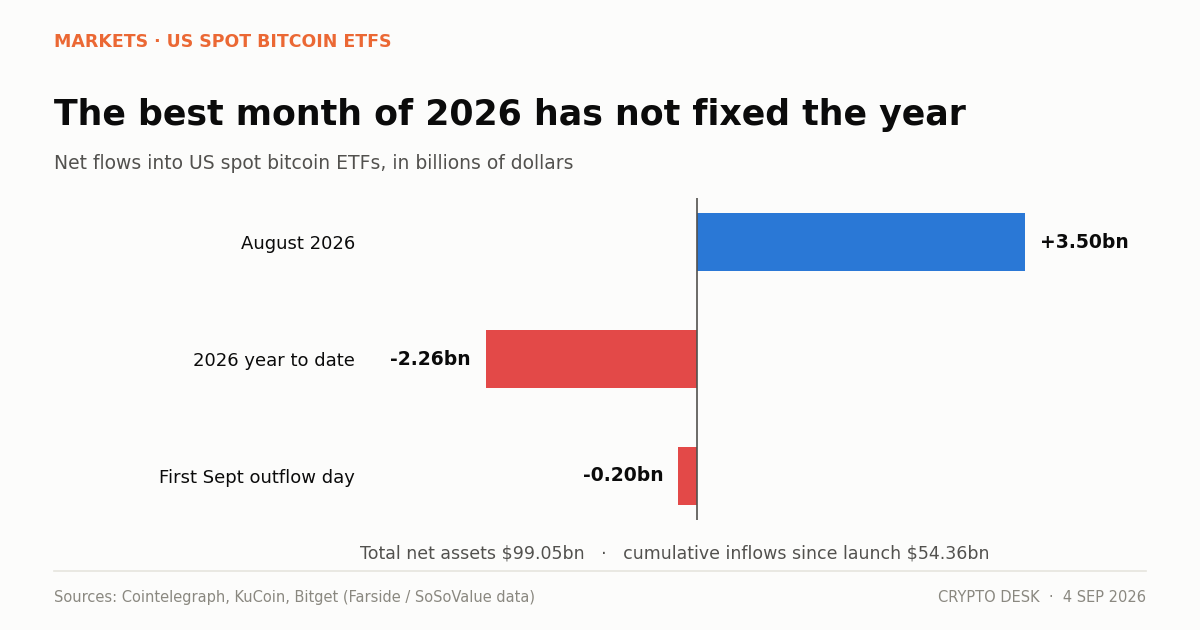
Bitcoin ETFs Just Had Their Best Month Since October 2025. September Started With an Outflow.
US spot bitcoin ETFs took in about $3.5bn in August 2026, the strongest month since October 2025. Then September opened with a $201.8m outflow.
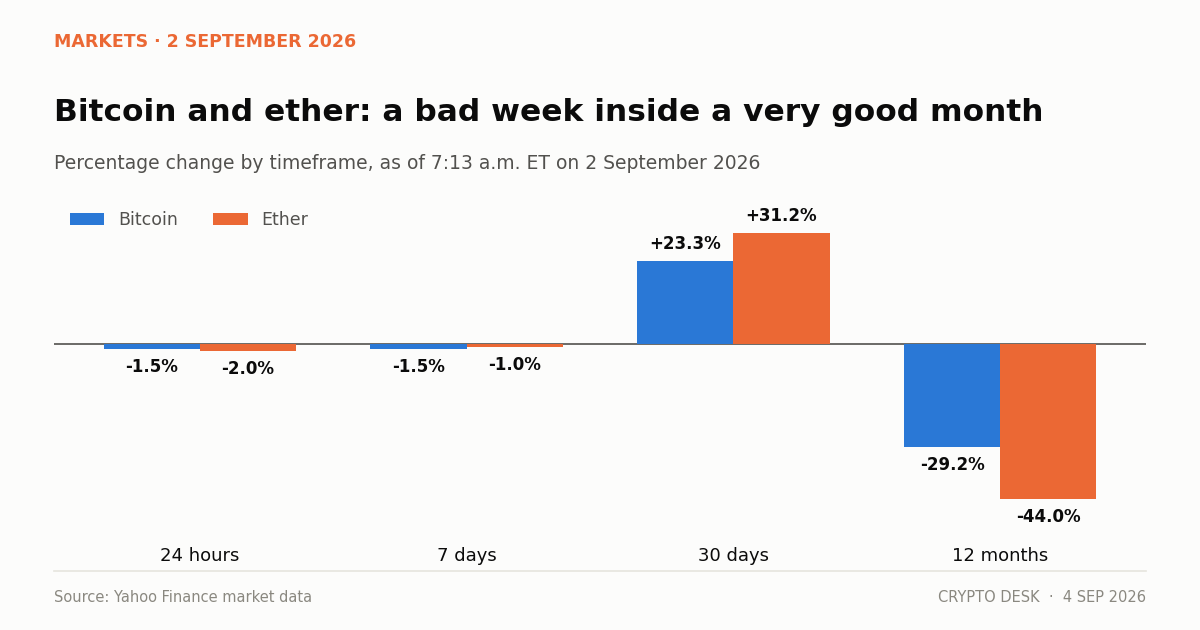
Bitcoin Slips Under $77,000 as Iran Strikes Pull Risk Assets Down
Bitcoin fell to $76,597 and ether to $2,373 on 2 September as US-Iran strikes lifted oil and revived rate-hike fears before the Fed meets.