Bitcoin Dominance Is 56.9% and Ether Is 11%. Everything Else Shares What Is Left.
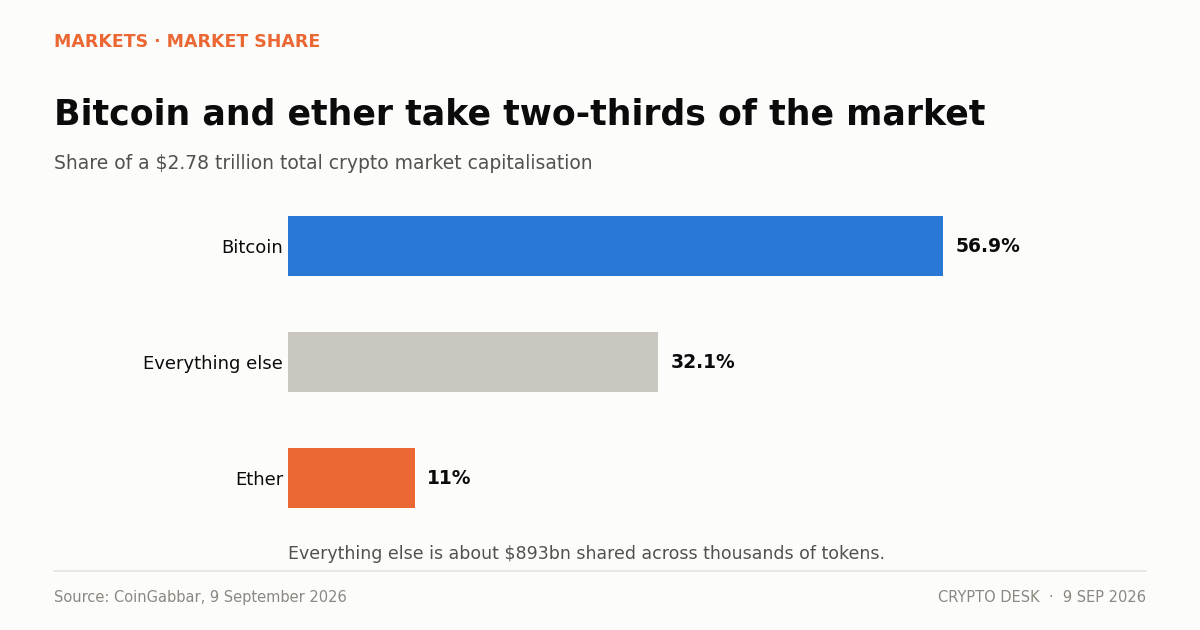
Bitcoin dominance stands at 56.9% and ether at 11%, leaving every other token to share the remaining 32.1% of a $2.78 trillion market.
On this page
- The split
- Why dominance rose
- What the 32% is doing
- Reading dominance correctly
- What would move it
- What to watch
- What dominance does not tell you
Of the $2.78 trillion in total crypto market capitalisation, bitcoin accounts for 56.9% and ether 11%. Every other token in existence — thousands of them — shares the remaining 32.1%, or roughly $893 billion.
That distribution is the clearest description available of what this cycle has actually been.
The split
| Segment | Share | Approximate value |
|---|---|---|
| Bitcoin | 56.9% | ~$1.58tn |
| Ether | 11.0% | ~$305bn |
| Everything else | 32.1% | ~$893bn |
For context on how unusual the concentration is: in the 2021 cycle peak, bitcoin dominance fell below 40% as capital rotated into a very long tail of tokens. The subsequent recovery has not reproduced that rotation.
Why dominance rose
Three structural changes explain most of it, and none is about anyone's opinion of altcoins.
The ETF wrapper is bitcoin-shaped. US spot bitcoin ETFs hold roughly $103 billion. Ether products hold about $15.6 billion. Solana and XRP funds sit near $1.5 billion each, and XRP's cumulative net inflows recently reached an all-time high of $1.68 billion. Institutional money arriving through regulated vehicles has overwhelmingly arrived in bitcoin, because that is where the product depth is.
Corporate treasuries buy bitcoin. Strategy holds 845,050 BTC. Metaplanet 43,000. Even the notable exception proves the shape of the rule: BitMine Immersion Technologies holds 5.93 million ETH worth part of a $15.7 billion crypto and cash position — a single company accounting for a meaningful slice of ether's institutional bid.
Mortgage and collateral rules named bitcoin. The FHFA directive counting crypto toward mortgage reserves launched with bitcoin and USDC only. Sberbank's collateral programme starts with bitcoin. Institutions that need one asset pick the one with the longest price history and deepest custody.
What the 32% is doing
Not much, in aggregate, and a great deal individually.
Zcash rose 38.5% over seven days on demand for Grayscale's newly converted ZCSH spot ETF, crossing $1,000 for the first time. XRP trades at $1.41 after eight consecutive green weeks for its ETF complex. Solana sits at $103.37.
And at the far end, a token called BUN gained 243,540% in a day on $1.09 million of volume while HOOD gained 923.3% on $412,660 — moves that say everything about order book depth and nothing about demand.
That is what a 32% share looks like from inside: a handful of assets with genuine institutional pathways, and a very long tail where a million dollars moves a price by three orders of magnitude.
Reading dominance correctly
Dominance is a ratio, and ratios move for two reasons. Bitcoin can rise, or everything else can fall. Both produce the same number and they mean different things.
Over the past year both assets fell — bitcoin roughly 27% and ether about 41%. Dominance rose because ether and the tail fell harder. That is a defensive rotation, not a bitcoin bull market.
The conventional reading is that falling dominance signals an altcoin cycle and rising dominance signals risk aversion. It is a reasonable heuristic with an important limitation: it was built in a market where nearly all crypto exposure was direct. In a market where $103 billion sits in bitcoin ETFs that cannot rotate into anything, some of the dominance is structural and will not reverse on sentiment.
What would move it
Staking approvals for ETFs. The SEC's Release 33-11426 review, closed to comment on 31 August, will determine whether US funds can pay staking rewards. A fund that captures a 3% to 7% network yield is a materially better product, and that improvement applies to ether and solana instead of to bitcoin.
More altcoin ETF assets. At roughly $1.5 billion each, solana and XRP funds are one-sixty-sixth of bitcoin's footprint. Closing that gap requires years, not quarters.
A genuine risk-on macro. Rate-hike odds above 60% on the CME FedWatch tool is not the environment in which capital moves out the risk curve and stays there.
What to watch
Dominance through the CPI print. A hawkish surprise usually raises it; a dovish one usually lowers it.
Ether's 11%. BitMine's accumulation and the quantum-resistance roadmap are ether-specific catalysts with no bitcoin equivalent.
Whether the tail's volume grows. Total market volume was $91.4 billion. Microcaps moving hundreds of percent on hundreds of thousands of dollars means the tail is thin, not that it is bid.
What dominance does not tell you
The metric has a structural blind spot worth naming.
Dominance is calculated on market capitalisation, which is price multiplied by circulating supply. Supply figures across the long tail are inconsistent — some projects count locked tokens, some do not, some have inflation schedules that add supply continuously.
That means the 32.1% attributed to everything outside bitcoin and ether is measured with far less precision than the 56.9% and 11% above it. Bitcoin's supply is known exactly. A microcap's is often a matter of the project's own reporting.
The practical consequence is that dominance is reliable as a directional signal and unreliable as a precise level. A move from 57% to 52% means something. A move from 56.9% to 56.7% is inside the measurement error of the denominator.
About this report. Dominance, market capitalisation and volume figures are from CoinGabbar's 9 September 2026 summary. Segment values are this desk's calculation from those percentages. ETF asset figures are from Cointelegraph, KuCoin and CryptoPotato coverage. Treasury holdings are from company disclosures as reported by The Block and PRNewswire.
Not investment advice. Dominance is a ratio and moves for reasons unrelated to any asset's prospects.
Frequently asked questions
What is bitcoin dominance right now?
56.9% of a $2.78 trillion total crypto market capitalisation, with ether at 11%. That leaves roughly $893 billion — 32.1% — shared across every other token. At the 2021 cycle peak, bitcoin dominance fell below 40%.
Why has bitcoin dominance stayed so high?
Three structural reasons: ETF assets are overwhelmingly bitcoin-shaped at roughly $103 billion against $15.6 billion for ether; corporate treasuries buy bitcoin, with Strategy alone holding 845,050 BTC; and collateral rules such as the FHFA mortgage reserve directive named bitcoin and USDC only.
Does rising dominance mean bitcoin is outperforming?
Not necessarily. Over twelve months bitcoin fell about 27% and ether about 41%. Dominance rose because the rest fell harder, which is a defensive rotation, not a bitcoin bull market.
What would lower bitcoin dominance?
Staking approval for US ETFs, which would advantage ether and solana products; substantially larger altcoin ETF assets, currently near $1.5 billion each for solana and XRP; and a genuine risk-on macro, which rate-hike odds above 60% do not describe.
Related reading
- Fed Hike Odds Pass 60% and Bitcoin Holds $78,900
- Bitcoin $82,000 Resistance: Three Rejections in Two Weeks
- Crypto Fear and Greed Index Falls to 66 on a Flat Tape
- Bitcoin Is Up 25% This Month and Down 27% This Year
Sources
- Crypto News September 9: Bitcoin Near $79K As BUN Token Surges 243K% — CoinGabbar
- 8 in a Row: Ripple (XRP) ETFs Record Another Green Week — CryptoPotato
- BitMine Adds 28,086 ETH, Treasury Hits 5.93M Tokens Worth $15.7B — The Crypto Times
- Crypto ETF Approval in the US: Why the SEC Is Rewriting Its Rules — CryptoTicker
Read next
- Sentiment Has Fallen for Three Sessions While Price Did Nothing. That Is the Momentum Draining Out. The crypto Fear and Greed Index slipped to 66 from 69 and 71 across three sessions while bitcoin barely moved…
- Stablecoins Turned Over $76 Billion in a Day on a $291 Billion Base The stablecoin market cap sits at $291.3 billion with $76.11 billion of daily volume — a turnover ratio no ot…
- IBIT Took $117 Million on a Friday Nobody Was Watching IBIT inflows of over $117 million on Friday extended a bitcoin ETF run of three consecutive positive weeks an…