Stablecoins Turned Over $76 Billion in a Day on a $291 Billion Base
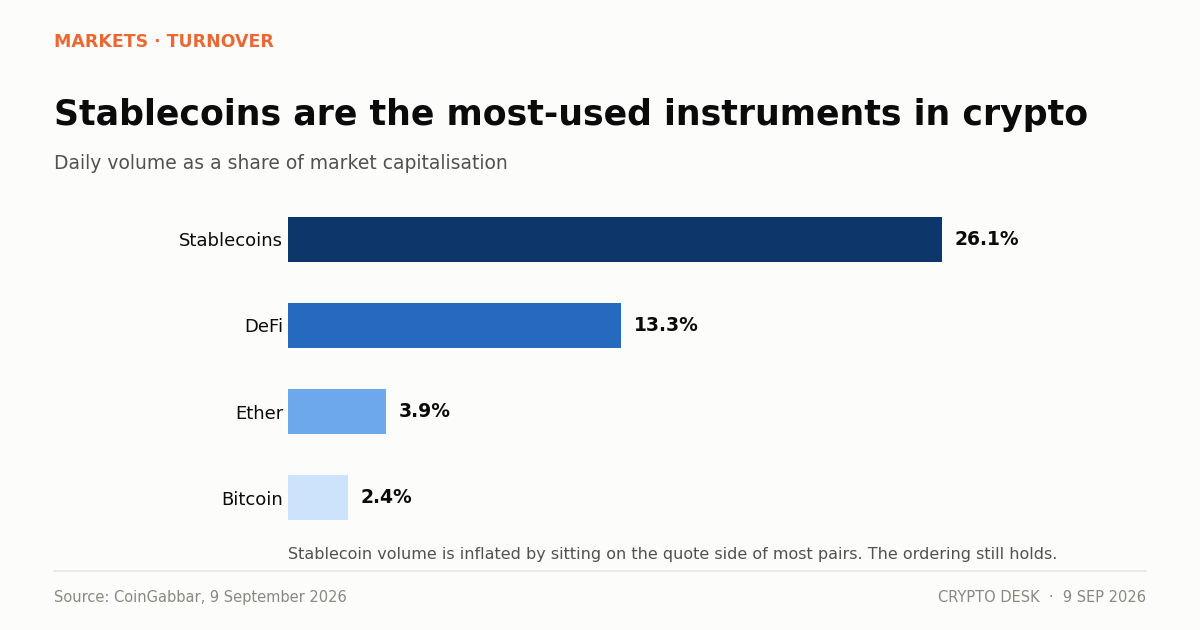
The stablecoin market cap sits at $291.3 billion against $76.11 billion of daily volume — a turnover ratio roughly ten times bitcoin's.
On this page
- How the stablecoin market cap compares on turnover
- What high velocity means
- The number that has not moved
- What changes in January
- What to watch
- What supply growth would actually signal
- Why the discrepancy between trackers matters
The stablecoin market capitalisation stands at $291.3 billion, up 0.1%. Stablecoin volume over twenty-four hours was $76.11 billion.
That is a turnover ratio of roughly 26% of the entire outstanding supply, in a single day.
How the stablecoin market cap compares on turnover
| Asset class | Market cap | 24h volume | Turnover |
|---|---|---|---|
| Stablecoins | $291.3bn | $76.11bn | ~26% |
| Bitcoin | ~$1.58tn | $37.2bn | ~2.4% |
| Ether | ~$304.5bn | $11.78bn | ~3.9% |
| DeFi | $78.2bn | $10.4bn | ~13% |
Bitcoin turns over about 2.4% of its value a day. Stablecoins turn over roughly ten times that share.
A caveat belongs here instead of in a footnote. Stablecoin volume is counted differently from an asset's own trading volume, because stablecoins sit on the quote side of most crypto pairs. A BTC/USDT trade contributes to both bitcoin's volume and USDT's. The 26% figure therefore overstates independent stablecoin activity.
Even after that adjustment the ordering holds. Stablecoins are the most-used instruments in crypto by a wide margin, and they are the only ones designed not to appreciate.
What high velocity means
It means stablecoins are being used, not held.
Bitcoin's low turnover reflects a holding asset — most of the supply sits still and the tradeable float is a fraction of the total. That is what a store-of-value profile looks like in the data.
Stablecoins show the opposite because they are working capital: the quote currency for most trading pairs, the settlement instrument for most on-chain transfers, and the collateral of choice across DeFi. Money that moves constantly is money doing a job.
It is also why stablecoin supply is a better read on market activity than price. Supply grows when new dollars enter and shrinks when they leave, and it does neither for sentiment reasons.
The number that has not moved
$291.3 billion, up 0.1%.
Over the past week that figure has been essentially static. Stablecoin net flows to exchanges turned positive on 1 September after 113 consecutive days of outflows, at $13.85 million, then halved to $6.85 million within two days.
Flat supply with positive but shrinking exchange inflows describes a market recycling existing capital rather than attracting new capital. That is consistent with everything else on the tape: bitcoin up 0.1%, global market capitalisation up 0.9%, sentiment falling from 71 to 66 across three sessions.
What changes in January
GENIUS Act enforcement begins in January 2027, or 120 days after final rules are published, whichever comes earlier.
The Act classifies payment stablecoin issuers as financial institutions under the Bank Secrecy Act — risk-based AML programmes, suspicious activity reporting, enhanced due diligence, and federal or state examination. Those obligations are marginal for a bank and transformative for a software company.
Industry estimates put compliance costs at 11% to 15.5% of payroll, comparable to a community bank. Below a few hundred million in supply the arithmetic stops working.
The competitive response is already visible. Twenty-one banks including Goldman Sachs and Citi are building a joint stablecoin venture for the first half of 2027. Qivalis has 37 European institutions behind a euro token. Open USD counts more than 140 companies including Visa, Mastercard and BlackRock.
What to watch
Whether supply grows past $291 billion. Growth means genuinely new dollars entering, which is the cleanest bullish signal available and has not appeared.
Exchange netflow sustaining. The 113-day outflow streak ended, then the inflow halved in 48 hours. Direction changed; magnitude did not follow.
Issuer concentration. Tether and Circle hold the large majority. If the tail shrinks below 15% over the coming year, GENIUS Act consolidation is happening as predicted.
Whether yield gets permitted. Whether issuers may pass returns to holders is one of four unresolved issues before the CLARITY Act's 15 September Senate cloture vote, and it decides whether stablecoins compete with bank deposits directly.
What supply growth would actually signal
Stablecoin supply is the closest thing crypto has to a money supply measure, and it behaves accordingly.
New supply is created when someone wires dollars to an issuer and receives tokens. That is an external capital inflow, unambiguous and hard to fake. Supply is destroyed on redemption, which is capital leaving.
Price can rise on leverage, on rotation, or on a short squeeze, all without a single new dollar entering. Supply cannot.
That is why a flat $291.3 billion during a 25% monthly rally in bitcoin is the most sobering datapoint available. The recovery has been funded by capital already inside the system moving between assets, not by new capital arriving.
Whether that matters depends on how much dry powder remains, and the flat supply figure suggests the answer is less than the price action implies.
Why the discrepancy between trackers matters
Different sources put the stablecoin market at different sizes, and the gap is large enough to change conclusions.
CoinGabbar reports $291.3 billion for 9 September. Other analyses have put the market at $314.68 billion as of June 2026. That is a difference of roughly 8%, and it is not a measurement error — it reflects different inclusion criteria. Some trackers count only fiat-backed payment stablecoins; others include yield-bearing and crypto-collateralised tokens.
For a reader, the practical rule is to compare a figure only against itself over time. A single tracker's series is internally consistent even when its absolute level differs from another's.
It also means any claim about stablecoin growth should name its source. The same market can be shown expanding or contracting over a given quarter depending on which definition is used, and both charts would be accurate.
About this report. Stablecoin market capitalisation and volume, and the comparative bitcoin, ether and DeFi figures, are from CoinGabbar's 9 September 2026 summary. Turnover ratios are this desk's calculations from those figures and are subject to the double-counting caveat above. Exchange netflow figures are from CryptoQuant data via DailyCoin. GENIUS Act dates and compliance estimates are from Value Add VC.
Not investment advice. Market structure data describes activity, not future prices.
Related reading
- Visa Stablecoin Payouts Settle in Under 30 Minutes
- Visa Mastercard Stripe Stablecoin Platform Takes Shape
- RWA Tokenization: BUIDL Past $2.5bn, Market Above $20bn
- Crypto VC Funding: 93% of $292M Went to Payments
Sources
- Crypto News September 9: Bitcoin Near $79K As BUN Token Surges 243K% — CoinGabbar
- Stablecoin Inflows Return After Nearly Four Months of Outflows — DailyCoin
- Stablecoin Regulation 2026: GENIUS Act Rules on a $314B Market — Value Add VC
- 21 Banks Are Not Just Building a Stablecoin — DailyCoin
Read next
- Sentiment Has Fallen for Three Sessions While Price Did Nothing. That Is the Momentum Draining Out. The crypto Fear and Greed Index slipped to 66 from 69 and 71 across three sessions while bitcoin barely moved…
- IBIT Took $117 Million on a Friday Nobody Was Watching IBIT inflows of over $117 million on Friday extended a bitcoin ETF run of three consecutive positive weeks an…
- Eight Green Weeks and a Record $1.68 Billion. The XRP ETF Story Has Two Cracks in It. XRP ETF inflows reached a record $1.68bn cumulative across eight consecutive green weeks, but the latest week…