IBIT Took $117 Million on a Friday Nobody Was Watching
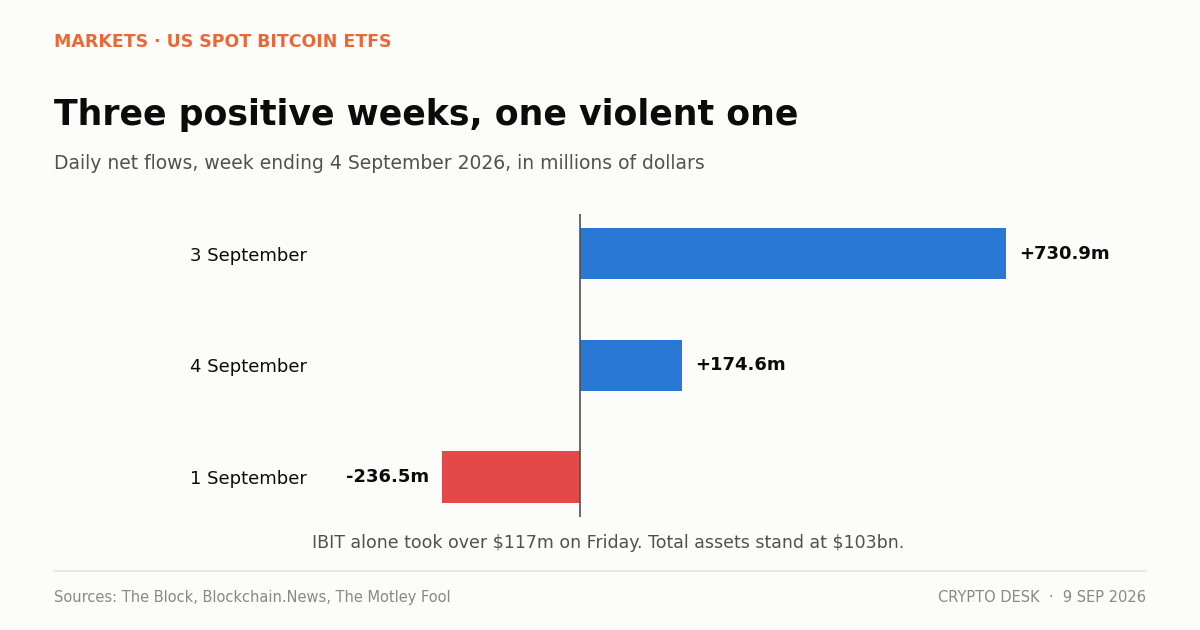
IBIT inflows of over $117 million on Friday extended a run of three consecutive positive weeks and total spot bitcoin ETF assets of $103 billion.
The recent flow record
| Period | Bitcoin ETF net flow |
|---|---|
| Friday 4 September | +$174.6m (IBIT: $117m+) |
| Thursday 3 September | +$730.9m |
| Tuesday 1 September | -$236.46m |
| Week to 4 September | +$986.85m |
| Trailing three weeks | +$3.8bn |
| Total assets | $103bn |
Three consecutive positive weeks, roughly $3.8 billion, total assets at $103 billion.
The year-to-date figure remains the corrective. US spot bitcoin ETFs entered September approximately $2.5 billion below where they started 2026. Another month at the current pace would flip it positive for the first time — a genuine milestone that has not yet arrived.
Why IBIT's share keeps mattering
On the largest day of the period, 3 September, roughly $454 million of the $730.9 million went to IBIT — about 62%.
Rachael Lucas of BTC Markets described the mechanism: "The concentration in IBIT is the tell. That is the wrapper institutions use for size, which points to allocation flow rather than tactical positioning."
The logic holds. A trader has options — futures, offshore perpetuals, spot, whichever fund has the tightest spread that morning. An institution executing an allocation routes to the deepest secondary market, because execution size matters more than a basis point of fee.
Sustained concentration in one wrapper is what committee decisions look like in flow data. Even distribution across ten funds looks like trading.
The tension in the data
The awkward part is what triggered the largest day. Thursday's $730.9 million followed Fed Governor Christopher Waller signalling support for a rate hold, which cut hike odds from about 63% toward 50%.
Allocation decisions are not usually made on an afternoon's news. Either the flows are more tactical than the concentration suggests, or the macro news released decisions already made and waiting for an entry point.
Both readings fit the data and they imply different things about durability.
What has changed since launch
Two and a half years in, the complex has gathered $103 billion — through a period in which bitcoin fell roughly 27% over twelve months and sits about 37% below its October 2025 record of $126,198.07.
Assets accumulated during a drawdown belong to holders with a longer horizon than assets accumulated at a top, because the people who bought the top have generally already left.
What has not been tested is sustained net redemption. The 2026 year-to-date deficit of roughly $2.5 billion accumulated gradually across many small outflow days instead of through a concentrated exit. How the redemption mechanism handles a large allocator leaving at size remains unknown.
What to watch
Whether the streak reaches four weeks. Through a week containing August CPI, the Fed decision and quadruple witching, that would be a meaningful signal.
The year-to-date figure crossing zero. Roughly $2.5 billion below baseline and closing.
IBIT's daily share. Sustained concentration supports the allocation reading; dispersion suggests tactical money.
Ether ETF flows alongside. The two complexes took a combined $1.2 billion in the week to 4 September, with ether contributing $218.41 million. A widening ratio would mean allocators are choosing between them instead of sizing the asset class.
The comparison that puts $103 billion in scale
Two and a half years to $103 billion is fast by any standard in asset management.
For context, the largest gold ETF took roughly a decade to reach comparable assets, and gold had no classification uncertainty, no custody novelty and no volatility of this magnitude.
That speed is the strongest available evidence that the demand was real and had been structurally blocked rather than absent. Money that arrives within months of a wrapper existing was waiting for the wrapper.
The corollary is less comfortable. Demand released by removing an obstacle is finite — it is the accumulated backlog, and once served it reverts to ordinary flow. The 2026 year-to-date deficit of roughly $2.5 billion may be exactly that transition, and August's recovery may be a second wave instead of a resumption of the first.
What the flow data cannot see
There is a category of demand entirely absent from these numbers, and it is not small.
Corporate treasuries buy outside the fund complex. Strategy purchased 4,603 BTC for $369.7 million in the same period — roughly a third of the entire ETF complex's weekly take, in one disclosure, invisible to daily flow trackers.
Offshore venues, direct custody arrangements and over-the-counter desks are similarly absent. The published figure covers regulated US wrappers, which is one channel among several.
That does not make it less useful. It makes it a measure of one specific buyer type, not of institutional demand generally, and the distinction matters whenever someone treats a weekly flow number as the market's verdict.
About this report. The IBIT Friday figure and market context are from The Motley Fool's 8 September 2026 summary. Daily and weekly flow figures are from The Block, Blockchain.News and KuCoin. Assets under management and the year-to-date position are from the Bitcoin News Digest of 6 September. The analyst quote is from The Block's 3 September coverage. Daily flow data is provisional and subject to revision.
Not investment advice. Fund flows describe past behaviour and do not forecast returns.
Frequently asked questions
How much did IBIT take in?
Over $117 million in net funds on Friday, within a $174.6 million day for spot bitcoin ETFs as a group. The week to 4 September delivered $986.85 million, a third consecutive positive week, with trailing three-week inflows of about $3.8 billion.
Are bitcoin ETFs positive for 2026?
Not yet. The complex entered September roughly $2.5 billion below where it started the year, despite total assets reaching $103 billion. Another month at the current pace would flip it positive for the first time.
Sources
- Crypto Market Today, Sept. 8: Bitcoin Slides as Fed Hike Odds Pass 60% — The Motley Fool
- U.S. Bitcoin and Ethereum ETFs Attract $1.2 Billion in Weekly Inflows — KuCoin
- US bitcoin ETFs report the largest inflow day since January, worth $731 million — The Block
- Bitcoin News Digest, September 6, 2026 — Mike Richardson
Read next
- Sentiment Has Fallen for Three Sessions While Price Did Nothing. That Is the Momentum Draining Out. The crypto Fear and Greed Index slipped to 66 from 69 and 71 across three sessions while bitcoin barely moved…
- Stablecoins Turned Over $76 Billion in a Day on a $291 Billion Base The stablecoin market cap sits at $291.3 billion with $76.11 billion of daily volume — a turnover ratio no ot…
- Eight Green Weeks and a Record $1.68 Billion. The XRP ETF Story Has Two Cracks in It. XRP ETF inflows reached a record $1.68bn cumulative across eight consecutive green weeks, but the latest week…