Sentiment Has Fallen for Three Sessions While Price Did Nothing. That Is the Momentum Draining Out.
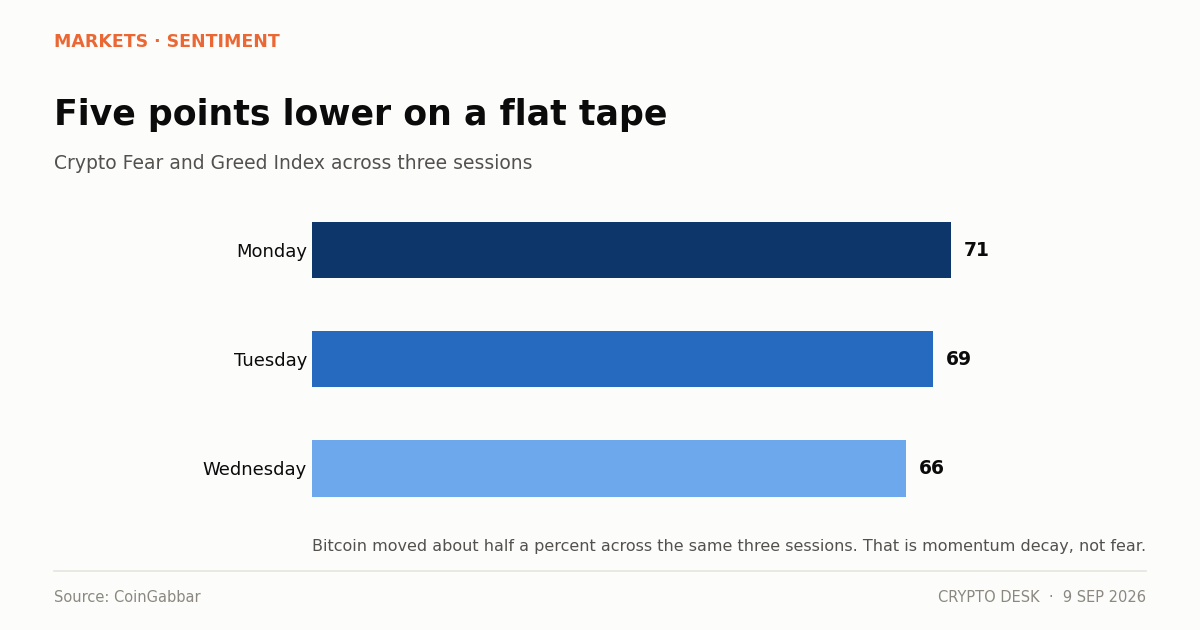
The crypto Fear and Greed Index reads 66, down from 69 and 71 across three sessions in which bitcoin moved about half a percent in total.
On this page
- What the crypto Fear and Greed Index actually measures
- Reading a decay, not a shock
- Where 66 sits historically
- What sits underneath it
- Why the index and the flows disagree
- What to watch
- Using the index properly
The Crypto Fear and Greed Index reads 66. It was 69 the previous day and 71 on Monday.
Over the same three sessions bitcoin went from $79,349.91 to $78,475.12 to $78,893.77 — a net move of about half a percent.
Sentiment fell five points on a flat tape. That combination is more informative than either number alone.
What the crypto Fear and Greed Index actually measures
The Fear and Greed Index is a composite, not a survey. It blends volatility, market momentum and volume, social media activity, and bitcoin dominance into a single score from 0 to 100.
Because it is a composite of mostly backward-looking inputs, it can move without any change in current price. A momentum component measures recent performance against a trailing window. As strong days age out of that window, the score falls even if today was unremarkable.
That is what is happening now. Bitcoin is up about 25% over thirty days, and the earliest and strongest of those days are rolling out of the calculation.
Reading a decay rather than a shock
The distinction matters for what you do with the information.
A sentiment shock is a sharp drop caused by an event — a crash, a hack, a regulatory decision. It signals that participants have changed their view.
A decay is what this is. Nothing happened. The index is telling you that the rally supporting the score is getting older, and unless new strong days arrive, the number keeps falling toward neutral regardless of price.
Anyone reading 66 as "the market is nervous" has the mechanism backwards. The market is not nervous. The market is not doing anything, and the index is designed to notice that.
Where 66 sits historically
| Range | Label |
|---|---|
| 0–24 | Extreme Fear |
| 25–49 | Fear |
| 50–74 | Greed |
| 75–100 | Extreme Greed |
At 66 the reading is comfortably inside Greed and well short of Extreme Greed.
The index has predictive value mainly at extremes, and the evidence for it is asymmetric. Readings below 20 have historically marked better entry points than readings above 80 have marked exits. Sixty-six carries almost no signal in either direction.
What sits underneath it
The macro backdrop has hardened while the index drifted. CME FedWatch odds of a September rate hike have passed 60%, up from around 59% on Monday and roughly 50% the previous week after Fed Governor Christopher Waller's dovish remarks.
Federal Reserve Chairman Kevin Warsh told Jackson Hole that inflation is the committee's predominant focus, with PCE at 3.7% over twelve months and 4.1% annualised over six, and that he would be "hard pressed to describe broad financial conditions as restrictive."
Against that, US spot bitcoin and ether ETFs took a combined $1.2 billion in the week to 4 September, a third consecutive positive week, and BlackRock's IBIT added over $117 million on Friday alone.
Money arriving while sentiment decays and rate odds tighten is the tension in this market, and no single indicator captures it.
Why the index and the flows disagree
Because they measure different people.
The Fear and Greed Index weights social media activity and short-term momentum — inputs dominated by retail and by traders. ETF flows measure allocators executing decisions on a committee timetable.
Those two groups have been doing different things for a month. Retail sentiment tracks the tape; allocators have been buying a drawdown. A market where the second group is more active than the first produces exactly this pattern: steady flows, flat price, drifting sentiment.
What to watch
Whether 50 gets tested. A fall into Neutral while price holds would confirm the momentum decay is complete and the score has reset.
A sharp drop on the CPI print. That would be a shock instead of a decay, and it would mean something different.
Whether social volume picks up. The component most likely to move quickly if retail returns.
Bitcoin dominance. At 56.9% it is one of the index inputs, and it has been elevated all year, which supports the score independently of price.
Using the index properly
The practical guidance is narrow, and narrower than most commentary implies.
At extremes it carries information. Readings below 20 have historically coincided with better entry points than readings above 80 have coincided with exits — an asymmetry worth knowing, since fear appears to be the more reliable signal than greed.
Between roughly 35 and 75, the index is describing the recent past and little else. It should not drive a decision.
Its better use is as a divergence detector. When the index and price move together, it confirms. When they diverge — as now, with sentiment falling on a flat tape — it flags that the composition of market participants is changing, which is worth investigating even though the index itself does not say how.
About this report. Fear and Greed readings and the daily comparison are from CoinGabbar's 8 and 9 September 2026 summaries. Price data is from Yahoo Finance and CoinGabbar for 7-9 September. Rate-odds figures are CME FedWatch data as reported by The Motley Fool. Warsh's remarks are from the Federal Reserve Board's publication of his Jackson Hole keynote. Index band labels are the published methodology.
Not investment advice. Sentiment indicators describe current conditions and have limited predictive value outside extremes.
Frequently asked questions
What is the crypto Fear and Greed Index at now?
66, inside Greed territory. It read 69 the previous day and 71 on Monday, while bitcoin went from $79,349.91 to $78,475.12 to $78,893.77 — a net move of roughly half a percent.
Why is sentiment falling when price is flat?
Because the index is a composite of largely backward-looking inputs. Its momentum component measures performance against a trailing window, so as the strongest days of the thirty-day rally age out, the score falls even when today was unremarkable. That is decay, not fear.
What do the index bands mean?
0 to 24 is Extreme Fear, 25 to 49 Fear, 50 to 74 Greed, and 75 to 100 Extreme Greed. At 66 the reading sits comfortably inside Greed and well short of Extreme Greed, where its predictive value is strongest.
Why do the index and ETF flows disagree?
They measure different people. The index weights social activity and short-term momentum, which are dominated by retail and traders. ETF flows measure allocators executing decisions on a committee timetable, and those groups have been doing opposite things for a month.
Sources
- Crypto News September 9: Bitcoin Near $79K As BUN Token Surges 243K% — CoinGabbar
- Crypto Market Today, Sept. 8: Bitcoin Slides as Fed Hike Odds Pass 60% — The Motley Fool
- Keynote remarks by Chairman Warsh at the 2026 Jackson Hole Economic Policy Symposium — Federal Reserve Board
- U.S. Bitcoin and Ethereum ETFs Attract $1.2 Billion in Weekly Inflows — KuCoin
Read next
- Stablecoins Turned Over $76 Billion in a Day on a $291 Billion Base The stablecoin market cap sits at $291.3 billion with $76.11 billion of daily volume — a turnover ratio no ot…
- IBIT Took $117 Million on a Friday Nobody Was Watching IBIT inflows of over $117 million on Friday extended a bitcoin ETF run of three consecutive positive weeks an…
- Eight Green Weeks and a Record $1.68 Billion. The XRP ETF Story Has Two Cracks in It. XRP ETF inflows reached a record $1.68bn cumulative across eight consecutive green weeks, but the latest week…