$731 Million in One Day: Bitcoin ETFs Post Their Biggest Session Since January
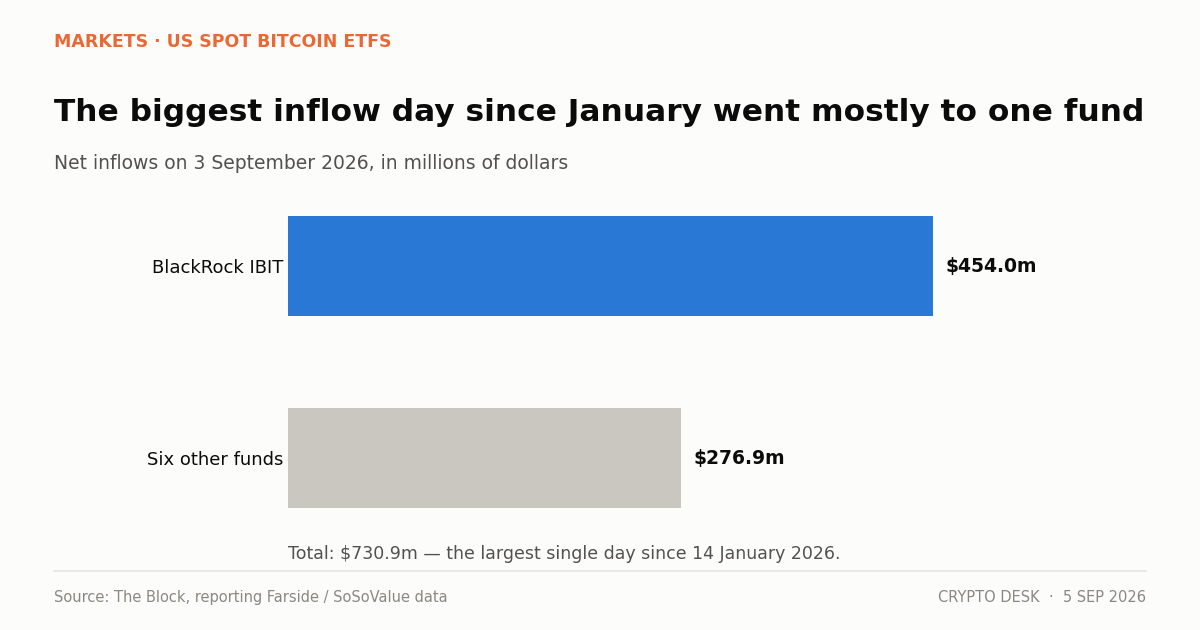
A bitcoin ETF record day delivered $730.9 million on 3 September 2026, the largest single session since 14 January, with BlackRock's IBIT taking about 62% of the total.
On this page
- What IBIT's share of the day tells you
- What triggered it
- Where this sits against the rest of the year
- What the January comparison means
- The ether divergence
- How to read flow data without being misled
- What to watch
- What $731 million buys at these prices
- The fee question, briefly
US spot bitcoin ETFs took in $730.9 million on 3 September. That is the largest single-day net inflow since 14 January 2026, and it arrived four days after the same products posted a $201.8 million outflow that ended a seven-session buying streak.
BlackRock's IBIT accounted for roughly $454 million of the total — about 62% of it. Six other funds recorded inflows, including products from Fidelity and Grayscale.
What IBIT's share of the day tells you
Rachael Lucas, an analyst at BTC Markets, put it directly: "The concentration in IBIT is the tell. That is the wrapper institutions use for size, which points to allocation flow, not tactical positioning."
That distinction is what the number is for, and it deserves unpacking.
A trader taking a tactical position in bitcoin has options: the futures market, an offshore perpetual, spot on an exchange, or whichever ETF has the tightest spread that morning. An institution making an allocation decision — a pension consultant adding a sleeve, a wealth platform onboarding a model portfolio — routes to the largest, most liquid product with the deepest secondary market, because size matters more than a basis point of fee. In this category that is IBIT, consistently and by a wide margin.
So a $731 million day where 62% lands in one fund reads differently from a $731 million day spread evenly across ten. The former looks like a decision made in an investment committee. The latter looks like traders.
What triggered it
Federal Reserve Governor Christopher Waller's remarks supporting a rate hold if inflation continues cooling. Odds of a September hike fell from around 63% to roughly 50%.
Bitcoin returned above $81,000 late Thursday and was trading near $80,950 the following morning. The ETF flow and the price move share a single cause, which is normal — allocators buy into strength as often as they buy weakness, because rebalancing rules and committee calendars do not care about entry timing.
Where this sits against the rest of the year
| Period | Net flow |
|---|---|
| 3 September 2026 (one day) | +$730.9m |
| August 2026 (full month) | ~+$3.5bn |
| First September outflow day | -$201.8m |
| 2026 year to date (through August) | -$2.26bn |
A single day at $731 million is roughly a fifth of August's entire haul. August itself was the strongest month since September 2025.
And the year-to-date figure is still negative. That is the context that keeps getting dropped from the headline. Even after the best month in a year and the best single day since January, the 2026 flow ledger for US spot bitcoin ETFs has not turned positive.
What the January comparison means
The previous record for the year was 14 January. Bitcoin traded materially higher then than it does now — the October 2025 all-time high of $126,198.07 was three months in the past rather than eleven, and the drawdown had not yet fully developed.
Matching January's flow at a price roughly 36% below the record is a different kind of signal than matching it near the highs. Money arriving after a drawdown is money that has decided the drawdown is the opportunity. Money arriving at the highs is momentum. The first is more durable, and it is also slower.
The ether divergence
While bitcoin funds were taking in $731 million, spot ether ETFs recorded a $48 million net outflow — ending a twelve-day streak of inflows.
Ether had outperformed bitcoin for most of August, gaining 35% on the month against bitcoin's 28.1%, with ETF assets reaching roughly $15.6 billion. Breaking the streak on the same day bitcoin posts its largest inflow since January suggests rotation instead of exit: allocators moving from the smaller position back to the larger one on a macro catalyst that applies to both.
One day does not establish that. It is the pattern to check over the next fortnight.
How to read flow data without being misled
Three things are worth knowing about these numbers, because they are reported with more precision than they actually carry.
They are revised. Daily figures come from fund share creation and redemption activity, compiled by trackers like Farside Investors and SoSoValue, and administrators finalise them a day or more later. Revisions of ten to twenty percent on a single day are ordinary.
They net. A $731 million net inflow does not mean $731 million was bought. It means creations exceeded redemptions by that amount. Gross activity in both directions is considerably larger.
They measure one buyer. Spot ETFs hold a large but minority share of bitcoin's float. Flows describe the behaviour of allocators who use regulated wrappers, and say nothing about direct holders, offshore venues, or corporate treasuries.
None of that makes the data less useful. It makes single-day headlines less useful than the rolling five-day direction.
What to watch
Whether IBIT keeps taking the majority share. Sustained concentration in the largest wrapper supports the allocation-flow reading. A shift toward even distribution would suggest tactical money returning.
Whether the year-to-date figure turns positive. At -$2.26 billion through August, roughly three more months like August would flip it. That would be the genuine milestone, and it has not happened yet.
The ether streak. Whether the twelve-day run resumes or the $48 million outflow becomes a pattern.
The Fed. The entire move traces back to one governor's comments on rate policy. The August jobs report released the following morning — 162,000 payrolls against a 53,000 forecast — pushed hike odds back up to roughly 59%. Flows that arrive on a macro read can leave on one.
What $731 million buys at these prices
At roughly $81,000, a $730.9 million net inflow represents about 9,020 bitcoin.
Daily issuance from mining is currently around 450 bitcoin. So one day of ETF creations absorbed roughly twenty days of new supply.
That comparison gets used a lot and it needs a caveat, because it is only half the picture. ETF creations are not sourced from newly mined coins; they are sourced from the existing float — sellers on exchanges, over-the-counter desks, and holders deciding to realise. The relevant question is not whether flows exceed issuance but whether they exceed the supply that existing holders are willing to part with at the current price.
That number is unobservable, which is why the issuance comparison persists despite explaining less than it appears to. What it does establish is scale: in a single session, one product category moved an amount of bitcoin that the network takes almost three weeks to create.
The fee question, briefly
IBIT's dominance is not only about liquidity. Fee competition in this category was fierce at launch and has stayed compressed, with the largest products clustered in a narrow band. When an allocator can get the deepest secondary market at essentially the same cost as a smaller fund, the decision makes itself.
That dynamic tends to reinforce itself: more assets bring tighter spreads, tighter spreads bring more institutional flow, and the gap widens. Smaller issuers in this category face a structural problem that no amount of marketing solves.
About this report. Flow figures are from The Block's reporting of 3 September data, with fund-level detail as published. Monthly and year-to-date figures are from Cointelegraph and KuCoin coverage of Farside and SoSoValue data. Daily flow numbers are provisional and subject to revision.
Not investment advice. Fund flows describe past behaviour and do not forecast returns.
Frequently asked questions
How big was the 3 September bitcoin ETF inflow?
$730.9 million, the largest single-day net inflow since 14 January 2026. BlackRock's IBIT accounted for roughly $454 million of it, with six other funds recording the remainder.
Why does IBIT's share matter?
Institutions route size to the largest, most liquid product because execution depth matters more than a basis point of fee. Concentration in one wrapper points to allocation decisions, not tactical trading.
Are bitcoin ETFs net positive for 2026?
Not yet. Year-to-date flows through August remained negative at roughly $2.26 billion, even after August delivered about $3.5 billion, the strongest month since October 2025.
Related reading
- IBIT Inflows Reach $117M as Bitcoin ETF Streak Extends
- XRP ETF Inflows Hit $1.68bn Across Eight Green Weeks
- ETFs vs Corporate Treasuries: Two Very Different Bids
- Zcash Price Up 38.5% in a Week as ZCSH ETF Draws Money
Sources
- US bitcoin ETFs report the largest inflow day since January, worth $731 million — The Block
- U.S. Bitcoin ETF Inflows Hit $731M, Best Day Since January — Bitget News
- Bitcoin ETFs post best day in 9 months as price hits $82,000 — Yahoo Finance
- Crypto Daily Market Report – September 4, 2026 — KuCoin
Read next
- Sentiment Has Fallen for Three Sessions While Price Did Nothing. That Is the Momentum Draining Out. The crypto Fear and Greed Index slipped to 66 from 69 and 71 across three sessions while bitcoin barely moved…
- Stablecoins Turned Over $76 Billion in a Day on a $291 Billion Base The stablecoin market cap sits at $291.3 billion with $76.11 billion of daily volume — a turnover ratio no ot…
- IBIT Took $117 Million on a Friday Nobody Was Watching IBIT inflows of over $117 million on Friday extended a bitcoin ETF run of three consecutive positive weeks an…