Eight Green Weeks and a Record $1.68 Billion. The XRP ETF Story Has Two Cracks in It.
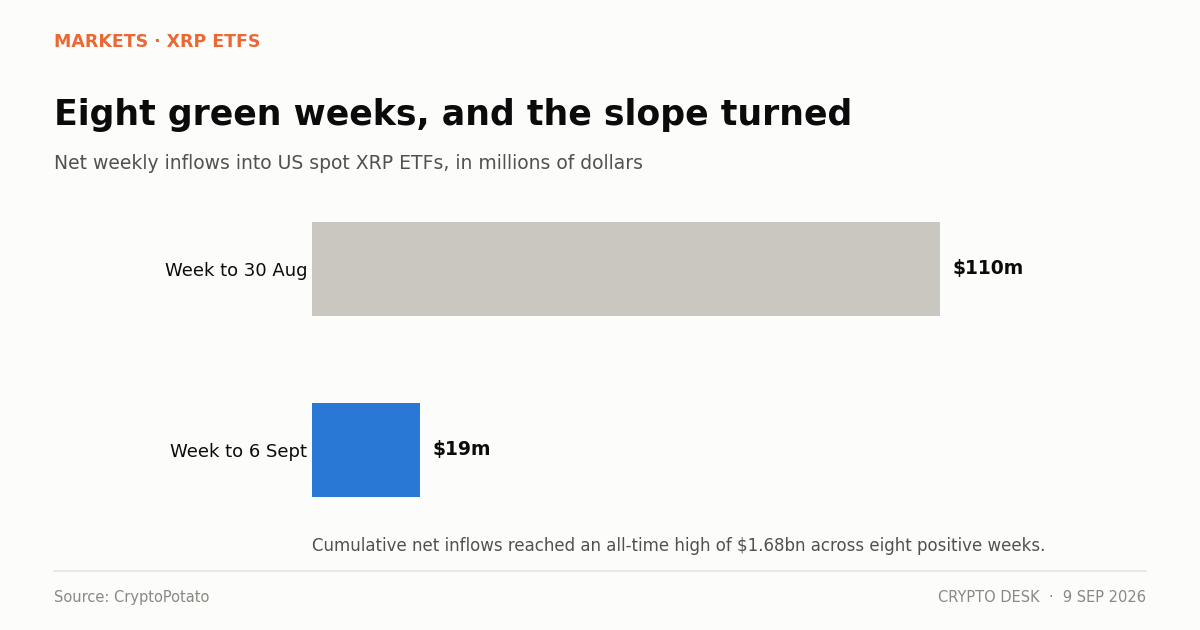
XRP ETF inflows reached a record $1.68 billion cumulative across eight consecutive green weeks, but the latest week delivered $19 million against $110 million the week before.
On this page
- XRP ETF inflows: the streak and the slope
- The price picture
- What the flow data actually tells you
- The two cracks, stated plainly
- The wider context
- What to watch
- What eight weeks of data is actually worth
Spot XRP ETFs took in roughly $19 million in the week ending 6 September. It was the eighth consecutive positive week, and cumulative net inflows reached an all-time high of $1.68 billion.
The previous week brought $110 million. This one brought $19 million — a decline of about 83%.
XRP ETF inflows: the streak and the slope
| Week | Net inflow |
|---|---|
| Week to 30 August | ~$110m |
| Week to 6 September | ~$19m |
A streak counts weeks. It does not weight them. Eight consecutive green weeks sounds like accelerating demand; the trajectory inside the most recent two says the opposite.
Two specific sessions inside that week are worth noting. Wednesday recorded a $7.20 million net outflow — the first red day since 5 August, ending a month-long run. Friday reported $0.00 in flows, which means no reportable creations or redemptions at all.
A zero-flow day in a product with $1.68 billion of cumulative inflows is not neutral. It means that on that session, nobody wanted to establish or exit a position at size.
The price picture
XRP dipped to $1.33 during the week, recovered to $1.45 by Friday, and settled at $1.41. It held above the $1.40 area that traders have been treating as support.
The relationship between flows and price here is looser than in bitcoin's case, and for a structural reason. XRP ETF assets are a small fraction of XRP's market capitalisation, so the fund complex is one buyer among many instead of close to the marginal buyer. Bitcoin ETFs hold roughly $103 billion; the XRP complex has taken $1.68 billion in total since launch.
That means XRP's price can move independently of these flows, and the flows are better read as a signal about one specific investor type than as a driver.
What the flow data actually tells you
It tells you how much American money wants regulated XRP exposure, and the answer is: real, but decelerating.
$1.68 billion in cumulative inflows is a genuine achievement for a product category that did not exist in usable form eighteen months ago. It arrived because generic listing standards — NYSE Arca Rule 5.2-E(j)(8), Nasdaq Rule 5704 and Cboe BZX Rule 14.11(l) — removed the need for a bespoke rule filing per asset.
It is also, in context, about 1.6% of what bitcoin ETFs hold. The listing bottleneck is gone; the demand gap is not.
The two cracks, stated plainly
The first red day since 5 August. A month-long streak of positive sessions ending is not itself alarming. It matters because it coincided with the weekly total collapsing by 83%.
A zero-flow Friday. This is the more unusual signal. Products with active institutional participation rarely print zero. It suggests the marginal buyer stepped back, not sold.
Neither is a reversal. Both are the kind of detail that precedes one often enough to be worth marking.
The wider context
XRP gained 2.0% over a recent twenty-four-hour window while bitcoin fell, and the broader market is contending with CME FedWatch odds of a September rate hike above 60%.
Altcoin ETF products have generally been holding up. Solana funds sit near $1.5 billion in assets, and Grayscale's ZCSH privacy-coin ETF drove Zcash up 38.5% over seven days. The category is not in retreat.
What the XRP numbers suggest is that the initial wave of allocators — the ones who wanted the exposure and were waiting for a compliant wrapper — has largely been served. What follows is ordinary flow, which is smaller and more sensitive to conditions.
What to watch
Whether week nine stays green. A ninth positive week at $19 million or below would confirm deceleration rather than a pause.
The $1.40 level. It has held on this test. A close below it removes the level traders have been defending.
Zero-flow days. One is noise. A pattern of them means the product has gone quiet.
Whether staking approval changes the category. The SEC's Release 33-11426 review closed to comment on 31 August. XRP does not have a staking yield in the way Solana or ether do, so a staking approval would advantage competing products instead of this one.
What eight weeks of data is actually worth
Streaks are a weak form of evidence and they get cited as a strong one.
Eight consecutive positive weeks in a product category sounds like sustained demand. But the streak counts sign, not size, and a week at $19 million counts identically to a week at $110 million. A product could post twelve green weeks while flows decline monotonically toward zero, and the streak headline would improve every week.
The more informative series is the four-week rolling average, which smooths the daily noise without hiding the trend. On the two weeks disclosed, that average is falling sharply.
None of which means the demand is gone. It means the metric being reported is the one least likely to show a change, and readers should ask for the other one.
About this report. Weekly and daily flow figures, the cumulative total, the streak count and the price levels are from CryptoPotato's reporting of the week ending 6 September 2026. The 83% decline is this desk's calculation from the cited weekly figures. Comparative ETF asset figures are from Cointelegraph and Bitcoin Foundation coverage. Exchange rule references are as cited by CryptoTicker.
Not investment advice. Fund flows describe past behaviour and do not forecast returns.
Related reading
- Microcap Crypto Gainers: BUN +243,540%, HOOD +923%
- Zcash Price Up 38.5% in a Week as ZCSH ETF Draws Money
- Meme Coins Rip 60-110% as Risk Appetite Returns to Crypto
- Altcoin Gainers 7 September: ORBIO +160%, SHRUB +121%
Sources
- 8 in a Row: Ripple (XRP) ETFs Record Another Green Week but Warning Signs Return — CryptoPotato
- XRP ETFs Recorded Over $150 Million in August — Yahoo Finance
- Crypto Market Today, Sept. 8 — The Motley Fool
- Crypto ETF Approval in the US: Why the SEC Is Rewriting Its Rules — CryptoTicker
Read next
- Sentiment Has Fallen for Three Sessions While Price Did Nothing. That Is the Momentum Draining Out. The crypto Fear and Greed Index slipped to 66 from 69 and 71 across three sessions while bitcoin barely moved…
- Stablecoins Turned Over $76 Billion in a Day on a $291 Billion Base The stablecoin market cap sits at $291.3 billion with $76.11 billion of daily volume — a turnover ratio no ot…
- IBIT Took $117 Million on a Friday Nobody Was Watching IBIT inflows of over $117 million on Friday extended a bitcoin ETF run of three consecutive positive weeks an…