Two Microcaps Ran 160% and 121% on a Day the Majors Went Nowhere
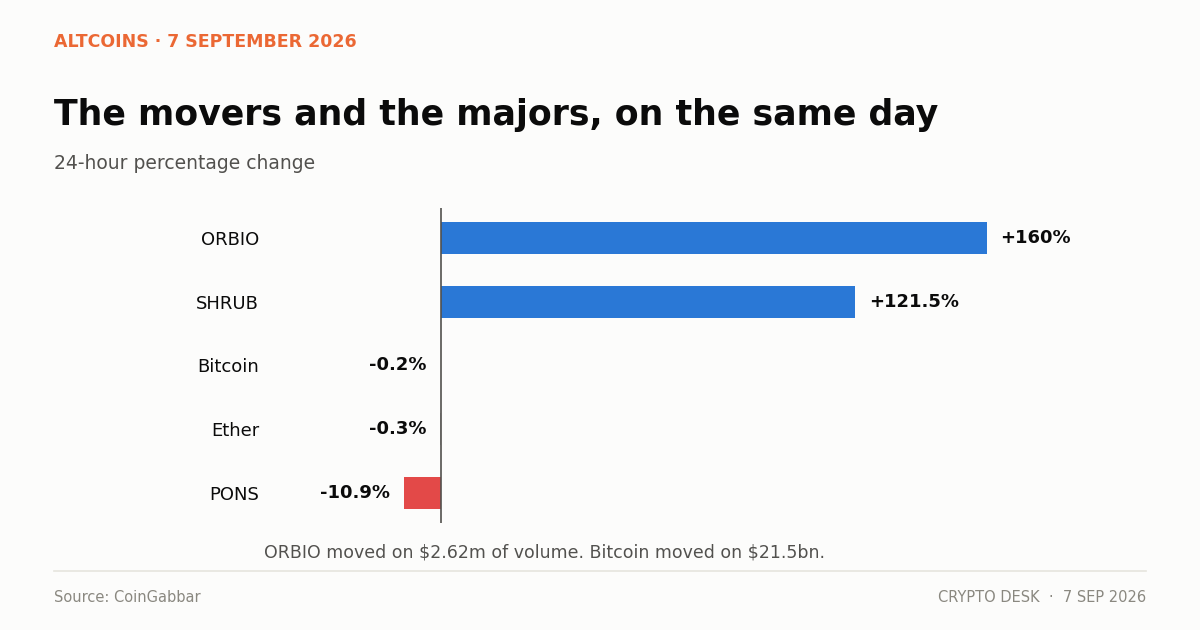
The altcoin gainers on 7 September were led by ORBIO at +160% and SHRUB at +121.5%, on a session when bitcoin fell 0.2% and the whole market slipped 0.3%.
On this page
- The day in full
- Why these moves are about liquidity, not demand
- What a 71 reading actually means
- The pattern this fits
- The context that should temper it
- How to read days like this
- What to watch
- The one number that would change this read
ORBIO rose 160% to $0.01784 on Monday. SHRUB, trading as Lil' Shrub, rose 121.5% to $0.07915. Bitcoin fell 0.2%. Ether fell 0.3%.
The gap between those numbers is the only thing worth analysing here, and it has nothing to do with either token.
The day in full
| Asset | Price | 24h change | Volume |
|---|---|---|---|
| ORBIO | $0.01784 | +160.0% | $2.62m |
| SHRUB (Lil' Shrub) | $0.07915 | +121.5% | $9.22m |
| Bitcoin | $79,794.23 | -0.2% | $21.5bn |
| Ether | $2,504 | -0.3% | $10.27bn |
| PONS | $0.7743 | -10.9% | $194.83m |
Global crypto market capitalisation stood at $2.77 trillion, down 0.3% on $70.8 billion of total volume. The Fear and Greed Index read 71 — Greed territory. The stablecoin market sat at $291 billion, up 0.1%, and DeFi market capitalisation at $79.8 billion, up 0.5%.
Why these moves are about liquidity, not demand
ORBIO turned over $2.62 million to move 160%. SHRUB turned over $9.22 million to move 121.5%. Bitcoin turned over $21.5 billion to move 0.2%.
That is not a comparison of conviction. It is a comparison of liquidity.
In a market with a thin order book, a small amount of buying consumes the available sell orders and price gaps upward. The move is real in the sense that trades occurred at those prices, but it says almost nothing about how much capital believes anything. A few million dollars can produce a 160% move in a token nobody is defending.
The same mechanic works in reverse, and considerably faster. Order books that thin on the way up are thinner on the way down, because the buyers who created the move are also the only bid.
What a 71 reading actually means
The Fear and Greed Index at 71 sits in Greed, and it has held there through a fortnight in which bitcoin traded from $76,229 to $82,281 and back to the high $79,000s.
The index composites volatility, momentum, volume, social sentiment and dominance. A sustained reading in Greed while price goes sideways usually reflects the momentum and volume components instead of genuine euphoria — the thirty-day picture is strong, with bitcoin up 25% and ether up 32.2%, and that feeds the score regardless of what that week did.
Where it becomes useful is at extremes. Readings above 80 have historically preceded corrections more often than continuations. At 71 the signal is weak.
The pattern this fits
Microcap outperformance on a flat day for majors is a recurring signal, and it has appeared repeatedly over the past week.
On 4 September, two meme tokens rose 60% and 110% while bitcoin gained 5.1%. Zcash crossed $1,000 on ETF-driven demand. DeFi governance tokens moved 10%. The pattern is consistent: capital at the far end of the risk curve is active.
That is meaningful in aggregate and meaningless per token. When the speculative end moves twenty to eighty times harder than the institutional end, it tells you a particular kind of participant is back — one who arrives early in recoveries and leaves fast when conditions tighten.
What it does not tell you is which token to own. The identity of the movers changes daily, and yesterday's 160% gainer is statistically unlikely to be tomorrow's.
The context that should temper it
Three things sit underneath that week's risk appetite, and none is settled.
August payrolls came in at 162,000 against a consensus near 55,000, pushing rate-hike odds to roughly 59%. Fed Chairman Kevin Warsh said at Jackson Hole that he would be "hard pressed to describe broad financial conditions as restrictive," with PCE inflation at 3.7%. August CPI and PPI arrive next week and economists describe them as capable of swinging the Fed between a hike and a hold.
Microcaps are the first thing sold when rate expectations tighten. A 160% move on $2.62 million of volume, two days before an inflation print that could reprice the entire risk curve, is a position with a very specific and very short shelf life.
How to read days like this
Three rules that hold up better than any individual token analysis.
Check volume against market capitalisation. A large percentage move on volume that is a fraction of the token's market cap is a liquidity event, not a demand event.
Treat the gradient as the signal, not the names. That microcaps outran majors by eighty times is information. Which microcaps did it is not.
Watch what funds the move. Leveraged rallies and spot-funded rallies look identical on a price chart and behave completely differently under stress. Stablecoin flows onto exchanges are the cleanest available proxy, and they turned positive only on 1 September after 113 days of outflows before halving within two days.
What to watch
Whether the movers hold their gains for 72 hours. Most do not.
Total volume against the majors. $70.8 billion across the whole market on a day bitcoin alone did $21.5 billion is thin. Rising total volume with continued microcap strength would be a stronger signal.
The Fear and Greed Index through the CPI print. A drop from 71 into neutral on the data would confirm that week's appetite was conditional on a dovish read.
The stablecoin market at $291 billion. Growth there means new dollars entering, rather than the same dollars rotating between assets.
The one number that would change this read
If the stablecoin market grows meaningfully from $291 billion, that week's risk appetite has spot money behind it. If it stays flat while microcaps run 160%, the moves are being funded by leverage and rotation out of existing positions.
The distinction matters because the two behave completely differently under stress. Spot-funded rallies retrace. Leverage-funded rallies cascade, because the same positions that pushed price up become forced sellers on the way down.
Stablecoin exchange flows turned positive on 1 September after 113 consecutive days of outflows, at $13.85 million, then halved to $6.85 million within two days. That is a direction change without a magnitude behind it — which describes that week's microcap action reasonably well.
About this report. Prices, percentage moves, volumes, market capitalisation and sentiment figures are from CoinGabbar's 7 September 2026 market summary. Bitcoin's price differs slightly from Yahoo Finance's $79,349.91 reading at 9:41 a.m. ET, reflecting different timestamps. Macro figures are from the BLS August release and the Federal Reserve Board's publication of Chairman Warsh's Jackson Hole keynote.
Not investment advice. Microcap tokens can lose most of their value in a single session and the tokens named here are cited as market data, not recommendations.
Frequently asked questions
Which altcoins gained the most on 7 September?
ORBIO rose 160% to $0.01784 on $2.62 million of volume, and SHRUB (Lil' Shrub) rose 121.5% to $0.07915 on $9.22 million. Bitcoin fell 0.2% and ether 0.3% over the same period.
Do large percentage moves in microcaps mean real demand?
Usually not. ORBIO moved 160% on $2.62 million of volume while bitcoin moved 0.2% on $21.5 billion. A thin order book gaps on small buying, and the same thinness accelerates the move in reverse.
What is the Fear and Greed Index reading?
71, inside Greed territory. It has held there through a fortnight in which bitcoin traded from $76,229 to $82,281 and back, driven more by the strong thirty-day momentum than by current euphoria.
Related reading
- Microcap Crypto Gainers: BUN +243,540%, HOOD +923%
- Zcash Price Up 38.5% in a Week as ZCSH ETF Draws Money
- XRP ETF Inflows Hit $1.68bn Across Eight Green Weeks
- Meme Coins Rip 60-110% as Risk Appetite Returns to Crypto
Sources
- Crypto News September 7: BTC Falls, ORBIO Gains 160%, SHRUB Surge 121% — CoinGabbar
- Bitcoin and ethereum prices today, Monday, September 7, 2026 — Yahoo Finance
- Keynote remarks by Chairman Warsh at the 2026 Jackson Hole Economic Policy Symposium — Federal Reserve Board
- Stablecoin Inflows Return After Nearly Four Months of Outflows — DailyCoin
Read next
- A Token Called BUN Rose 243,540% on a Million Dollars. That Is Not a Rally. Microcap crypto gainers ran to absurd levels as BUN rose 243,540% on $1.09m of volume while bitcoin moved 0.1…
- Zcash Added 38.5% in a Week. The Privacy Trade Has Outrun Everything Else in Crypto. The Zcash price rose 38.5% over seven days, extending a run that has taken ZEC past $1,000 for the first time…
- Zcash Passes $1,000 for the First Time, Carried by the First US Privacy-Coin ETF ZEC reached $1,018 on 5 September, up 28% in a week and over 2,000% in a year, after Grayscale converted its …