Three Attempts, One Level: Why $82,000 Keeps Turning Bitcoin Back
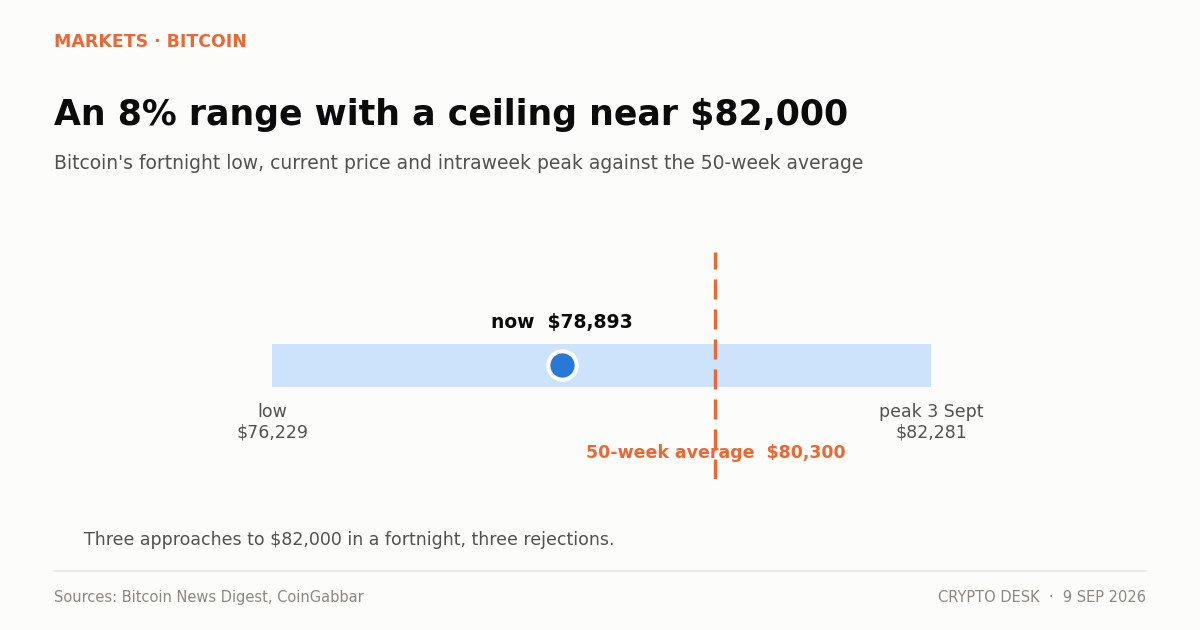
Bitcoin resistance at $82,000 has now turned price back three times in a fortnight, with the 50-week moving average at $80,300 sitting inside the range as additional overhead.
On this page
- The recent range
- What repeated bitcoin resistance actually means
- Why the attempts happened at all
- What would change it
- The downside marker
- What to watch
- The summary
- What a failed breakout costs
Bitcoin has approached $82,000 three times in the past fortnight and been turned back each time. It printed an intraweek high of $82,281 on 3 September, and by the weekly close it was at $77,024. On Wednesday it traded at $78,893.77.
The $80,000 level, which gets more attention because it is round, has been the less reliable marker. It has been crossed in both directions repeatedly. The ceiling that has actually held is about two thousand dollars above it.
The recent range
| Date | Level |
|---|---|
| 2 September low | $76,229 |
| 3 September high | $82,281 |
| 6 September weekly close | $77,024 |
| 7 September | $79,349 |
| 8 September | $78,475 |
| 9 September | $78,893 |
That is a $6,052 range — roughly 8% — traded twice in both directions, resolving to the middle.
The 50-week moving average sits at approximately $80,300, inside that range and above current price. Every rally has run into it, and every retreat has started near it.
What repeated bitcoin resistance actually means
Levels do not have magic properties. What they have is memory.
When price approaches an area where a large number of people bought previously, some of them sell to get out at breakeven. That supply is real, it is concentrated in a narrow band, and it does not require anyone to believe anything about bitcoin. It requires only that they would like their money back.
At $82,000, bitcoin is roughly 35% below its October 2025 record of $126,198.07. The people who bought in the $80,000s on the way down have been waiting a long time, and each approach to that level gives them an exit.
The reason the 50-week average matters is the same reason, expressed as a statistic: it approximates where the average buyer of the past year sits.
Why the attempts happened at all
Each of the three approaches had a specific, external cause.
The 3 September run to $82,281 followed Fed Governor Christopher Waller signalling support for holding rates, which cut September hike odds from about 63% toward 50%. More than $400 million of short positions were liquidated, and the forced buying carried price into the resistance band.
That is a useful detail. A rally driven substantially by short liquidation has a built-in stopping point — it ends when the leveraged shorts are cleared. Which is roughly what happened at $82,281.
What would change it
A break through $82,000 that holds requires supply at that level to be absorbed, and that means sustained buying, not a squeeze.
The candidate source is the ETF complex. US spot bitcoin ETFs took in $986.85 million in the week to 4 September, a third consecutive positive week, with BlackRock's IBIT adding over $117 million on Friday alone. That is real spot buying that hits the same order books.
The problem is size. Roughly $1 billion a week is meaningful but not overwhelming against $37.2 billion of daily volume, and it has not yet been enough.
The other candidate is a macro shift. Rate-hike odds now sit above 60% on the CME FedWatch tool. A soft August CPI print that pushed those odds back toward a hold would remove the headwind, and the market has demonstrated twice this month that it moves 5% on that kind of news.
The downside marker
If $82,000 is the ceiling, $76,229 is the floor that has been tested — the 2 September low, set on the Iran escalation that took Brent above $98.
Between them sits an 8% band that has contained everything for two weeks. Ranges resolve eventually, and they usually resolve in the direction of the prevailing macro rather than the prevailing chart.
Right now the prevailing macro is a Federal Reserve chairman saying financial conditions are not restrictive with inflation at 3.7%.
What to watch
A weekly close above $80,300. Reclaiming the 50-week average on a weekly basis, not intraday, would be the first genuine technical improvement in a month.
Volume on the next approach. A test of $82,000 on rising spot volume is different from one driven by liquidations. The liquidation data is published; check it before reading the move.
August CPI. The single input most likely to break the range in either direction.
Whether $76,229 holds. It has been tested once. A second test that fails puts the June lows in the high $50,000s back into the conversation, and that is a different market entirely.
The summary
Bitcoin has an 8% range, a ceiling near $82,000 reinforced by a 50-week average at $80,300, and a floor at $76,229. It has spent a fortnight inside it.
Ranges are not forecasts. They are descriptions of where the arguments are currently balanced, and this one is waiting on an inflation number.
What a failed breakout costs
There is a cost to approaching a level three times and failing, and it is not psychological.
Each attempt consumes buying power. The traders who bought the run to $82,281 on 3 September and watched price close the week at $77,024 are now holding losing positions near the level, which adds them to the supply that turned price back in the first place.
That is why repeated failed tests make a level harder to clear instead of easier. Every attempt manufactures more overhead supply.
The counterweight is time. Supply at a level is finite, and holders who wanted out eventually get out. A range that persists for months typically resolves when that overhead has been absorbed, which is a slow process and an invisible one until it is finished.
About this report. Price levels, the weekly close and the 50-week moving average are from the Bitcoin News Digest of 6 September 2026 and CoinGabbar's 9 September summary. Liquidation and rate-odds figures are from KuCoin and Motley Fool coverage. ETF flow data is from KuCoin's weekly summary. Technical levels are descriptive, not predictive.
Not investment advice. Support and resistance levels describe past trading and do not constrain future prices.
Related reading
- Fed Hike Odds Pass 60% and Bitcoin Holds $78,900
- Bitcoin Dominance at 56.9% Leaves Altcoins 32% of the Market
- Crypto Fear and Greed Index Falls to 66 on a Flat Tape
- Bitcoin Is Up 25% This Month and Down 27% This Year
Sources
- Bitcoin Keeps Getting Rejected at $82,000. Can It Break Through in September 2026? — 24/7 Wall St.
- Bitcoin News Digest, September 6, 2026 — Mike Richardson
- Crypto Market Today, Sept. 8: Bitcoin Slides as Fed Hike Odds Pass 60% — The Motley Fool
- U.S. Bitcoin and Ethereum ETFs Attract $1.2 Billion in Weekly Inflows — KuCoin
Read next
- Sentiment Has Fallen for Three Sessions While Price Did Nothing. That Is the Momentum Draining Out. The crypto Fear and Greed Index slipped to 66 from 69 and 71 across three sessions while bitcoin barely moved…
- Stablecoins Turned Over $76 Billion in a Day on a $291 Billion Base The stablecoin market cap sits at $291.3 billion with $76.11 billion of daily volume — a turnover ratio no ot…
- IBIT Took $117 Million on a Friday Nobody Was Watching IBIT inflows of over $117 million on Friday extended a bitcoin ETF run of three consecutive positive weeks an…