Bitcoin Touched $82,281 and Closed the Week at $77,024. The 50-Week Average Is Now Overhead.
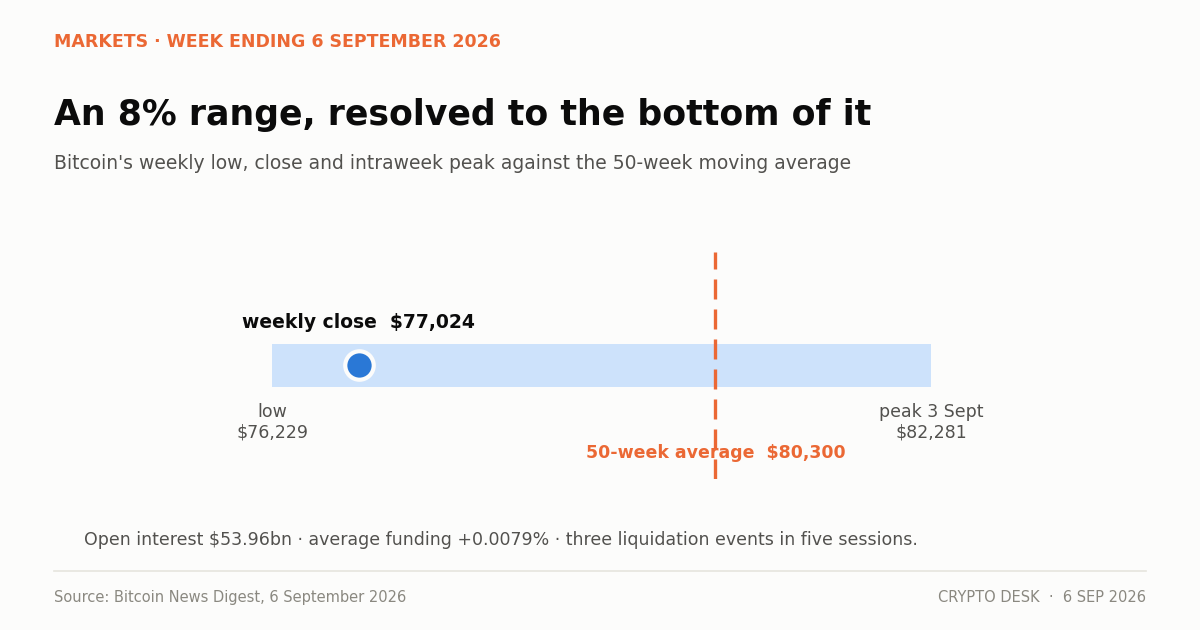
The bitcoin weekly close came in at $77,024 after an intraweek peak of $82,281, leaving price back below the 50-week moving average at $80,300.
On this page
- The week, in order
- Why the 50-week average matters more than the close
- The derivatives picture
- What the ETF flows did
- The macro backdrop is not helping
- What is different about this drawdown
- What to watch this week
- The range is the information
Bitcoin printed an intraday high of $82,281 on Wednesday 3 September and a low of $76,229 on Tuesday 2 September. It closed the week at $77,024.
That is a range of just over $6,000 — roughly 8% — resolved to the bottom of it. And it puts price back below the 50-week moving average at $80,300, a level that had been support and is now resistance.
The week, in order
Monday and Tuesday. US strikes on Iranian targets pushed Brent above $98 a barrel. Risk assets sold. Bitcoin hit $76,229 on the Tuesday, with $77.08 million of liquidations.
Wednesday. Fed Governor Christopher Waller signalled support for holding rates if inflation continues cooling. September hike odds fell from about 63% toward 50%. Bitcoin ran to $82,281 in a short squeeze that produced between $318 million and $510 million of liquidations depending on the venue count.
Thursday. US spot bitcoin ETFs took in $731 million — the largest single day since 14 January.
Friday. August payrolls came in at 162,000 against a consensus near 55,000. Hike odds moved back up. Price gave up the week's gains.
Weekend. Close at $77,024.
Five sessions, two complete reversals of direction, and a net weekly change close to nothing. Neither reversal originated in crypto.
Why the 50-week average matters more than the close
The 50-week moving average currently sits at $80,300. Price closed $3,276 below it.
Moving averages are not magic, and traders who treat them as such lose money. What they do provide is a rough summary of where the average buyer over the past year sits. When price trades below a rising long-term average, the average holder of the past year is underwater, and rallies into that level tend to meet supply from people getting out at breakeven.
That is the mechanical reason a reclaimed 50-week average matters and a lost one hurts. Bitcoin reclaimed it during Wednesday's squeeze and lost it again by the weekly close, which makes the whole move a failed test rather than a breakout.
There is a second reference level worth knowing: the 1,130-day simple moving average, a long-cycle band that has marked structural support in previous drawdowns. It sits well below current price and has not been tested this cycle.
The derivatives picture
Total open interest across bitcoin derivatives stands at approximately $53.96 billion. The average funding rate is +0.0079%.
A positive funding rate means longs are paying shorts to hold their positions — the market is net long and paying for it. At +0.0079% per funding period, the cost is modest instead of extreme; readings above +0.05% have historically marked crowded positioning that precedes flushes.
So the current setup is: mildly long-biased positioning, $54 billion of open exposure, and price below a widely watched long-term average. That combination produces sharp moves in both directions, which is precisely what the past week delivered.
The liquidation sequence tells the same story. $400 million on 30 August, $77.08 million on 2 September, then $318 million to $510 million on 3 September. Three separate flushes in five sessions, in alternating directions.
What the ETF flows did
The fund complex had a similarly whipsawed week: $236.46 million of outflows on 1 September, then $731 million of inflows on 3 September.
Zooming out slightly gives a cleaner read. Total spot ETF assets under management now stand at $103 billion, and the trailing three weeks have produced $3.8 billion of net inflows. August alone contributed roughly $3.5 billion, the strongest month since October 2025.
That is real accumulation. It has not been enough to hold the 50-week average, which tells you something about the size of the offsetting supply.
The macro backdrop is not helping
Three numbers frame the week better than any chart.
The 30-year Treasury yield reached 5.26%, a cycle high. The 10-year sits at 4.788% and the five-year at 4.5%. US sovereign debt has passed $40 trillion.
Long-end yields at cycle highs are the single most hostile backdrop for a non-yielding asset. Every basis point of increase in the long-term discount rate reduces the present value of an asset whose entire worth is a claim on future price. That the market rallied 8% intraweek against that backdrop says more about positioning than about conviction.
Brent above $98 adds the inflation channel. Energy costs feed headline inflation with a one-to-three-month lag, which constrains the Fed precisely when the labour market is printing 162,000 jobs.
What is different about this drawdown
One structural shift is worth noting because it complicates the usual analysis.
Bitcoin's 90-day correlation with the Nasdaq 100 has fallen to around 33%, from over 60% earlier in the year. Its correlation with gold has risen above 50% — a six-year high. The bitcoin-to-gold ratio sits at 18 ounces, the highest since January.
If that shift persists, the framework for reading bitcoin changes. An asset correlated to gold trades on debasement concerns and real yields, not on tech-equity risk appetite. Whether the shift is durable or an artefact of a few months of unusual flows is unresolved, and it is the most interesting open question in the market right now.
What to watch this week
15–18 September. Three events in four days: the Senate cloture vote on the CLARITY Act on the 15th, the Federal Reserve decision and dot plot on the 16th, and quadruple witching on the 18th. Any one of them moves markets. Together they are the densest risk window of the quarter.
The 50-week average at $80,300. Reclaiming it on a weekly close would invalidate the failed-test read. Repeated rejections there would confirm it.
Funding rates. If they climb above +0.05% while price stalls below the average, the setup for a long flush is in place.
ETF flows. $3.8 billion over three weeks is genuine. Whether it continues while price makes lower highs is the test of whether allocators are buying the drawdown or chasing the bounce.
The range is the information
Six thousand dollars of intraweek range on a $77,000 asset is roughly 8%. For context, that is what the S&P 500 might deliver across a quarter in an unremarkable year.
Ranges that wide, resolving to nothing, come from a specific market condition: two-sided conviction with no dominant flow. Buyers were willing to pay $82,281 on Wednesday. Sellers were willing to accept $76,229 on Tuesday. Neither group was large enough to establish a direction, and both were leveraged enough that the other side's moves forced liquidations rather than orderly repricing.
The practical implication is about position sizing instead of direction. In a market that can travel 8% in either direction within a week on external news, a position sized for a 3% adverse move is a position that gets closed by noise. That is how a market with $53.96 billion of open interest produces three separate liquidation events in five sessions without ever establishing a trend.
The condition usually resolves when a genuinely new input arrives. Three of those are scheduled for the coming week.
About this report. Weekly high, low, close, moving average, open interest, funding and liquidation figures are from the Bitcoin News Digest of 6 September 2026. ETF flow and AUM figures are from the same source. Yield and commodity levels are as cited there. Correlation figures are Bitwise and Grayscale analysis via the Kobeissi Letter and CryptoPotato. Levels move; check live data.
Not investment advice. Moving averages describe past prices and do not predict future ones.
Frequently asked questions
What was bitcoin's weekly close?
$77,024 for the week ending 6 September 2026, after an intraweek high of $82,281 on 3 September and a low of $76,229 on 2 September — a range of just over 8%, resolved at the bottom.
Why does the 50-week moving average matter?
It approximates where the average buyer of the past year sits. Below a rising long-term average, that average holder is underwater, so rallies into the level meet supply from people exiting at breakeven.
What is bitcoin's open interest and funding rate?
Total derivatives open interest stands at about $53.96 billion with an average funding rate of +0.0079%. Positive funding means longs pay shorts; readings above +0.05% have historically marked crowded positioning.
Related reading
- Fed Hike Odds Pass 60% and Bitcoin Holds $78,900
- Bitcoin $82,000 Resistance: Three Rejections in Two Weeks
- Bitcoin Dominance at 56.9% Leaves Altcoins 32% of the Market
- Crypto Fear and Greed Index Falls to 66 on a Flat Tape
Sources
- Bitcoin News Digest, September 6, 2026 — Mike Richardson
- September, Not October, May Test Crypto's Big 2026 Rally — DailyCoin
- Bitcoin's Link to Gold Hits a 6-Year High as Tech Correlation Fades — CryptoPotato
- U.S. payrolls rose 162,000 in August — CNBC
Read next
- Sentiment Has Fallen for Three Sessions While Price Did Nothing. That Is the Momentum Draining Out. The crypto Fear and Greed Index slipped to 66 from 69 and 71 across three sessions while bitcoin barely moved…
- Stablecoins Turned Over $76 Billion in a Day on a $291 Billion Base The stablecoin market cap sits at $291.3 billion with $76.11 billion of daily volume — a turnover ratio no ot…
- IBIT Took $117 Million on a Friday Nobody Was Watching IBIT inflows of over $117 million on Friday extended a bitcoin ETF run of three consecutive positive weeks an…