A Third Straight Week of Inflows, and the Year-to-Date Ledger Is Finally Close to Even
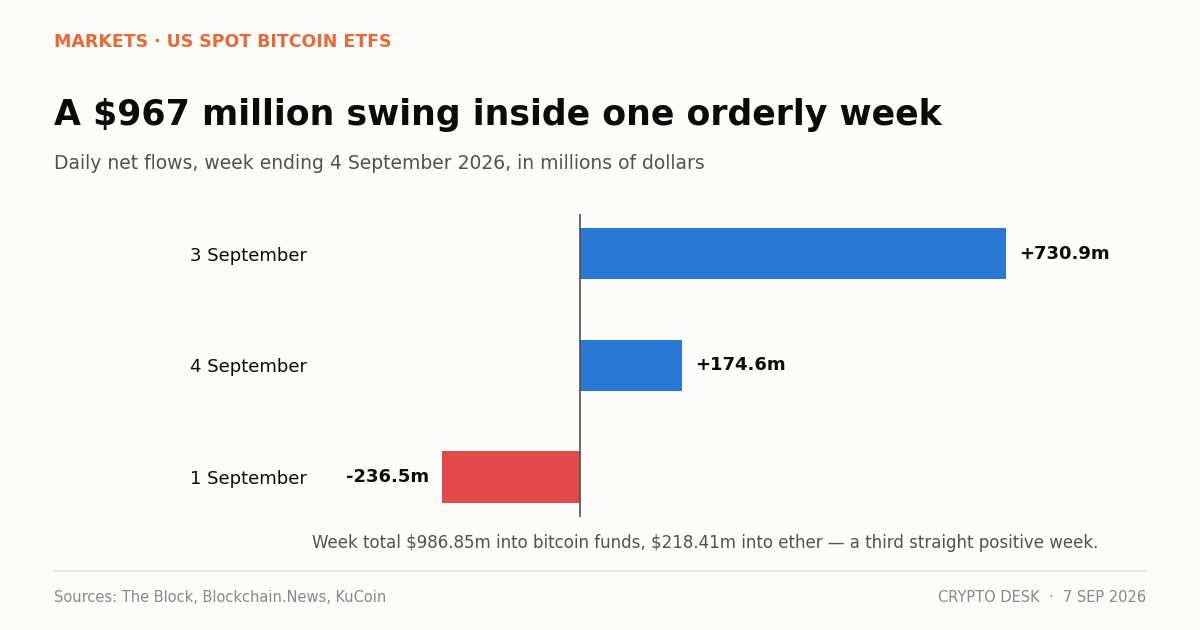
Bitcoin ETF weekly inflows reached $986.85 million in the week ending 4 September, with ether funds adding $218.41 million for a combined $1.2 billion and a third straight positive week.
On this page
- The week in the daily numbers
- Why the concentration is the useful detail
- Bitcoin ETF weekly inflows against the year-to-date position
- The ether side
- What flow data is good for, and what it is not
- The week ahead is the test
- What to watch
- Why weekly beats daily for this data
US spot bitcoin ETFs took in $986.85 million in the week ending 4 September. Ether funds added $218.41 million. Combined, $1.2 billion in five sessions, and a third consecutive week of net inflows.
For a product set that spent most of 2026 in net redemption, three weeks is the longest constructive run since the spring.
The week in the daily numbers
| Date | Bitcoin ETF net flow |
|---|---|
| 1 September | -$236.46m |
| 3 September | +$730.9m |
| 4 September | +$174.6m |
| Week total | +$986.85m |
That is a $967 million swing between Tuesday and Thursday. The weekly aggregate looks orderly; the sessions inside it were not.
Neither large day had anything to do with bitcoin. Tuesday's redemption followed US strikes on Iranian targets that pushed Brent above $98 and pressured risk assets broadly. Thursday's inflow followed Fed Governor Christopher Waller signalling support for a rate hold, which cut September hike odds from about 63% toward 50%.
Of Thursday's $730.9 million, roughly $454 million went to BlackRock's IBIT — about 62% into a single fund.
Why the concentration is the useful detail
Rachael Lucas of BTC Markets described the mechanism: "The concentration in IBIT is the tell. That is the wrapper institutions use for size, which points to allocation flow, not tactical positioning."
The logic holds up. A trader choosing crypto exposure has options — futures, offshore perpetuals, spot, whichever fund has the tightest spread that morning. An institution executing an allocation decision routes to the deepest secondary market, because size matters more than a basis point of fee.
Concentration in the largest wrapper is what committee decisions look like in flow data. Even distribution across ten funds looks like trading.
The awkward part is that the trigger was an afternoon of Fed commentary. Allocation decisions are not usually made that fast. Both facts are in the data and they do not fully reconcile.
Bitcoin ETF weekly inflows against the year-to-date position
This is the number that keeps disappearing from coverage.
US spot bitcoin ETFs entered September roughly $2.5 billion below where they started 2026, despite August delivering about $3.5 billion — the strongest month since October 2025 — and despite total assets reaching $103 billion.
Three weeks at $3.8 billion cumulative has cut into that deficit substantially. Another month at this pace would flip the year positive for the first time.
That would be the genuine milestone. It has not happened yet, and every headline about record inflow days should be read against it.
The ether side
$218.41 million in a week is modest next to bitcoin's $986.85 million — a ratio of about 4.5 to 1.
Ether products hold roughly $15.6 billion against bitcoin's $103 billion, so the flow ratio is broadly proportional to the existing asset base. What makes it notable is that the week included a $48 million ether outflow on 3 September that ended a twelve-day inflow streak, on the same session bitcoin posted its largest day since January.
Recovering to a positive week after that break suggests the streak-ending day was a rotation artefact rather than a turn. One week does not settle it.
Ether has meanwhile outperformed on price: up 32.2% over thirty days against bitcoin's 25%, though still down 41.2% over twelve months against bitcoin's 27.1%.
What flow data is good for, and what it is not
Three properties are worth knowing.
They are revised. Trackers derive them from fund share creation and redemption activity, and administrators finalise the figures a day or more later. Single-day revisions of ten to twenty percent are ordinary, which is why the weekly figure is more reliable than any session within it.
They are net. A $986.85 million weekly inflow means creations exceeded redemptions by that amount. Gross two-way activity is considerably larger.
They measure one buyer. $103 billion is a large but minority share of bitcoin's float. Flows describe allocators using regulated wrappers, and say nothing about direct holders, offshore venues or corporate treasuries — Strategy bought 4,603 BTC for $369.7 million in the same period, entirely outside this data.
The week ahead is the test
Three scheduled events land between 15 and 18 September: the Senate cloture vote on the CLARITY Act on the 15th, the Federal Reserve decision and dot plot on the 16th, and quadruple witching on the 18th.
August CPI and PPI arrive before all of it, and economists describe those prints as capable of swinging the Fed between a hike and a hold.
Allocators buying into that window is a materially different signal from allocators waiting for it to clear. A fourth consecutive positive week ahead of the data would be more informative than any single day this month.
What to watch
Whether the streak reaches four. Three weeks is a run. Four through a contested data week is a pattern.
The year-to-date figure crossing zero. Roughly $2.5 billion below baseline, closing.
IBIT's share. Sustained concentration supports the allocation reading.
The bitcoin-to-ether flow ratio. At 4.5 to 1 it currently tracks the asset bases. A widening ratio would signal allocators choosing between the two instead of sizing the asset class.
Why weekly beats daily for this data
There is a practical reason to read these numbers weekly, beyond the revisions.
Fund creations and redemptions settle on a T+1 basis, and authorised participants often batch their activity. A large allocation executed on a Tuesday can appear in Wednesday's figure, or split across both. Reading a single session as a discrete decision attributes precision the mechanism does not have.
Weekly aggregation smooths that out. It also matches how the decisions are actually made — investment committees meet on weekly or monthly cycles, not in response to an afternoon's news.
The $967 million swing between Tuesday and Thursday looks dramatic and largely is not. The $986.85 million weekly total, arriving in the third consecutive positive week, is the number that describes what allocators did.
About this report. Weekly flow figures are from KuCoin's summary and Bitget's reporting of the week ending 4 September 2026. Daily figures are from The Block and Blockchain.News. The IBIT breakdown and analyst quote are from The Block's 3 September coverage. Assets under management and year-to-date figures are from the Bitcoin News Digest of 6 September. Daily flow data is provisional and subject to revision.
Not investment advice. Fund flows describe past behaviour and do not forecast returns.
Frequently asked questions
How much did bitcoin ETFs take in last week?
$986.85 million in the week ending 4 September 2026, with ether funds adding $218.41 million for a combined $1.2 billion. It was the third consecutive week of net inflows.
Are bitcoin ETFs positive for 2026 yet?
Not quite. The complex entered September roughly $2.5 billion below where it started the year, despite total assets reaching $103 billion and August delivering about $3.5 billion. Another month at this pace would flip it.
Why did daily flows swing so much inside the week?
A $236.46 million outflow on 1 September followed US strikes on Iran; a $730.9 million inflow on 3 September followed dovish Fed comments from Governor Waller. That is a $967 million swing in three sessions on macro news alone.
Related reading
- IBIT Inflows Reach $117M as Bitcoin ETF Streak Extends
- XRP ETF Inflows Hit $1.68bn Across Eight Green Weeks
- ETFs vs Corporate Treasuries: Two Very Different Bids
- Zcash Price Up 38.5% in a Week as ZCSH ETF Draws Money
Sources
- U.S. Bitcoin and Ethereum ETFs Attract $1.2 Billion in Weekly Inflows — KuCoin
- Bitcoin Spot ETFs Pull $987M Week of Sept 4 — Three-Week Inflow Streak Holds — Bitget News
- Bitcoin ETF: $174.6M Net Inflow on Sep 4 — Blockchain.News
- US bitcoin ETFs report the largest inflow day since January, worth $731 million — The Block
Read next
- Sentiment Has Fallen for Three Sessions While Price Did Nothing. That Is the Momentum Draining Out. The crypto Fear and Greed Index slipped to 66 from 69 and 71 across three sessions while bitcoin barely moved…
- Stablecoins Turned Over $76 Billion in a Day on a $291 Billion Base The stablecoin market cap sits at $291.3 billion with $76.11 billion of daily volume — a turnover ratio no ot…
- IBIT Took $117 Million on a Friday Nobody Was Watching IBIT inflows of over $117 million on Friday extended a bitcoin ETF run of three consecutive positive weeks an…