After 113 Days, Stablecoins Started Flowing Back to Exchanges. Then the Flow Halved in 48 Hours.
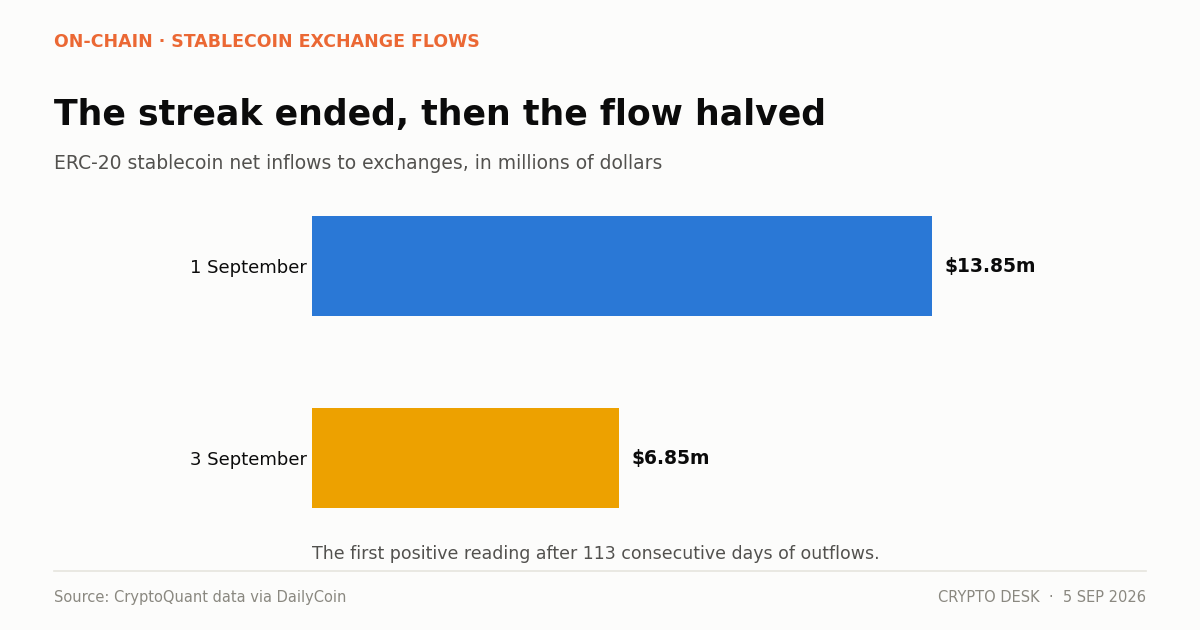
Stablecoin exchange netflow turned positive on 1 September 2026, ending 113 consecutive days of outflows — then the inflow halved from $13.85 million to $6.85 million within two days.
On this page
- What stablecoin exchange netflow measures
- Why 113 days matters
- Why the magnitude undercuts the headline
- The analyst read
- How this fits the week
- What would confirm it
- Direction changed, magnitude did not
- A caution about on-chain indicators generally
Stablecoin net flows to exchanges turned positive on 1 September 2026, ending 113 consecutive days of outflows that ran from May through 31 August.
The reversal lasted about two days at full strength. ERC-20 stablecoins showed $13.85 million of net inflows on 1 September. By 3 September that had fallen to $6.85 million — a decline of roughly 51%.
Both facts are the story. Neither is complete without the other.
What stablecoin exchange netflow measures
Stablecoin exchange netflow tracks whether dollar-pegged tokens are moving onto trading venues or off them.
The interpretation is mechanical rather than sentimental. Stablecoins sitting on an exchange are dollars positioned to buy. Stablecoins withdrawn to a private wallet or deployed into a DeFi protocol are dollars doing something else. Sustained inflows mean buying power is assembling; sustained outflows mean it is dispersing.
It is one of the more honest on-chain indicators because it measures a decision instead of an inference. Somebody chose to move funds to a venue where the only thing to do with them is trade.
Why 113 days matters
Nearly four months of continuous outflows is a long stretch by the standards of this metric. It covers the period from May through the end of August — precisely the window in which bitcoin fell from its post-record range toward the $60,000s and $70,000s and the sector's twelve-month drawdown deepened to the 27% currently visible.
That correspondence is not coincidental, though the causation runs in both directions. Falling prices prompt withdrawals; withdrawn buying power removes bids; removed bids allow further falls. It is the reflexive loop that makes drawdowns persistent.
Ending that streak is therefore genuinely notable. It is the first evidence in four months that the loop has stopped running in one direction.
Why the magnitude undercuts the headline
$13.85 million is a small number in this market.
For scale: US spot bitcoin ETFs took in $730.9 million in a single day on 3 September. The stablecoin market itself is worth roughly $314 billion. Daily spot volume across major exchanges runs into the tens of billions.
A $13.85 million net inflow is, relative to those figures, a rounding error. What makes it worth reporting is the sign change, not the size — the difference between negative and positive, after 113 days of negative.
And it did not hold. Halving to $6.85 million within two days is exactly the pattern you would expect from a one-off repositioning, not the beginning of a sustained liquidity expansion.
The analyst read
On-chain analyst Axel Adler Jr. was explicitly cautious: "Exchange flows are no longer clearly negative, while SSR is retreating from its recent local high, but neither metric confirms a sustained expansion in liquidity yet."
SSR is the Stablecoin Supply Ratio — bitcoin's market capitalisation divided by the total stablecoin supply. A falling SSR means stablecoin supply is growing relative to bitcoin's value, which implies more dollar-denominated buying power available per unit of bitcoin. It is a rough proxy for how much dry powder exists.
Adler's point is that two indicators are pointing the right way and neither has confirmed. Flows are no longer negative, but they are not convincingly positive. SSR is retreating from a local high, but has not established a downtrend.
That is a careful reading and a correct one. It is also the sort of qualification that gets dropped when a metric produces a headline.
How this fits the week
The stablecoin reversal arrived alongside several other things pointing the same direction.
Bitcoin ETFs recorded their largest inflow day since January at $730.9 million on 3 September, with BlackRock's IBIT taking roughly $454 million of it. Fed Governor Christopher Waller signalled support for a rate hold, cutting September hike odds from about 63% to roughly 50%. Bitcoin reclaimed $81,000 with a 5.1% session, and more than $400 million of shorts were liquidated.
Meanwhile Zcash crossed $1,000 on ETF inflows, Ethena's fee switch passed, Uniswap rallied on Robinhood Chain revenue, and meme coins ran 60% to 110%.
The stablecoin flow reversal is the least dramatic item on that list and arguably the most structurally meaningful, because it measures capital positioning rather than price. Prices can move on leverage. Stablecoins arriving on exchanges is spot money getting ready.
The problem is that $13.85 million falling to $6.85 million is not much capital getting ready.
What would confirm it
Three things, in order of importance.
Sustained positive netflow for two to three weeks. A streak of comparable length to the outflow it replaced, at a magnitude that scales with the market instead of a rounding error.
Growing total stablecoin supply. Exchange netflow measures where existing stablecoins sit. New issuance — the total market growing past its $314 billion level — means genuinely new dollars entering, not the same dollars moving around.
SSR establishing a downtrend. Not just retreating from a local high, but sustaining lower levels.
None of those has happened. All three are checkable weekly, and together they are a better read on the market's underlying liquidity than any price chart.
Direction changed, magnitude did not
A 113-day streak of stablecoins leaving exchanges ended on 1 September. The inflow that ended it was small and halved within two days.
That is a change in direction, not yet a change in condition. Anyone treating it as confirmation that liquidity has returned is reading more into $13.85 million than $13.85 million can carry.
A caution about on-chain indicators generally
Exchange netflow is a useful metric and it is also easier to misread than most.
Providers differ in which stablecoins they count, which exchanges they classify as exchanges, and how they handle internal transfers between an exchange's own wallets. Two reputable sources can report different signs on the same day for the same underlying activity. The figures here cover ERC-20 stablecoins specifically, which excludes substantial volume on Tron, Solana and other chains where USDT in particular moves heavily.
There is also a structural drift worth knowing. As more trading migrates to on-chain venues and as institutional custody arrangements grow, the meaning of "stablecoins on an exchange" changes. Dollars sitting in a prime broker's custody arrangement are just as ready to buy as dollars on Binance, and they do not appear in this metric.
None of that makes the indicator useless. It makes it a directional signal, not a precise measurement, and it argues for reading it alongside ETF flows, funding rates and total stablecoin supply rather than on its own.
Practically, the way to use it is as a veto instead of a trigger. A price rally with stablecoins still leaving exchanges is a rally funded by leverage, and those retrace. A rally with dollars arriving has spot money behind it. This week's data sits awkwardly between the two, which is itself the useful conclusion.
About this report. Netflow figures and the 113-day streak are from CryptoQuant data as reported by DailyCoin, with analyst commentary from Axel Adler Jr. Comparative ETF and price figures are from The Block, Yahoo Finance and KuCoin for 3–4 September 2026. On-chain flow data varies by provider depending on which stablecoins and exchanges are included.
Not investment advice. On-chain indicators describe positioning, not future prices.
Frequently asked questions
What does stablecoin exchange netflow measure?
Whether dollar-pegged tokens are moving onto trading venues or off them. Stablecoins on an exchange are dollars positioned to buy; stablecoins withdrawn to a private wallet or a DeFi protocol are dollars doing something else.
How long was the outflow streak?
113 consecutive days, running from May through 31 August 2026. It ended on 1 September with $13.85 million of ERC-20 stablecoin net inflows, which fell to $6.85 million by 3 September.
Does this mean liquidity is returning?
Not confirmed. Analyst Axel Adler Jr. noted that exchange flows are no longer clearly negative and the Stablecoin Supply Ratio is retreating from a local high, but neither metric confirms a sustained expansion in liquidity yet.
Related reading
- Liquid Hack: 85% of Bitcoin Returned, $47M Kept as Bounty
- Elements Range Proof Bug: How 4,000 Fake L-BTC Was Minted
- White Hat Bounty Norms: Who Decides What a Hacker Keeps?
- DeFi Market Cap $78bn Against $1.6bn in 2026 Hack Losses
Sources
- Stablecoin Inflows Return After Nearly Four Months of Outflows — DailyCoin
- Stablecoin net inflows turn positive after 113 days, market impact remains limited — CoinTurk
- All Stablecoins (ERC20): Exchange Netflow (Total) — CryptoQuant
- Crypto Daily Market Report – September 4, 2026 — KuCoin
Read next
- Sentiment Has Fallen for Three Sessions While Price Did Nothing. That Is the Momentum Draining Out. The crypto Fear and Greed Index slipped to 66 from 69 and 71 across three sessions while bitcoin barely moved…
- Stablecoins Turned Over $76 Billion in a Day on a $291 Billion Base The stablecoin market cap sits at $291.3 billion with $76.11 billion of daily volume — a turnover ratio no ot…
- IBIT Took $117 Million on a Friday Nobody Was Watching IBIT inflows of over $117 million on Friday extended a bitcoin ETF run of three consecutive positive weeks an…