Bitcoin ETFs Just Had Their Best Month Since October 2025. September Started With an Outflow.
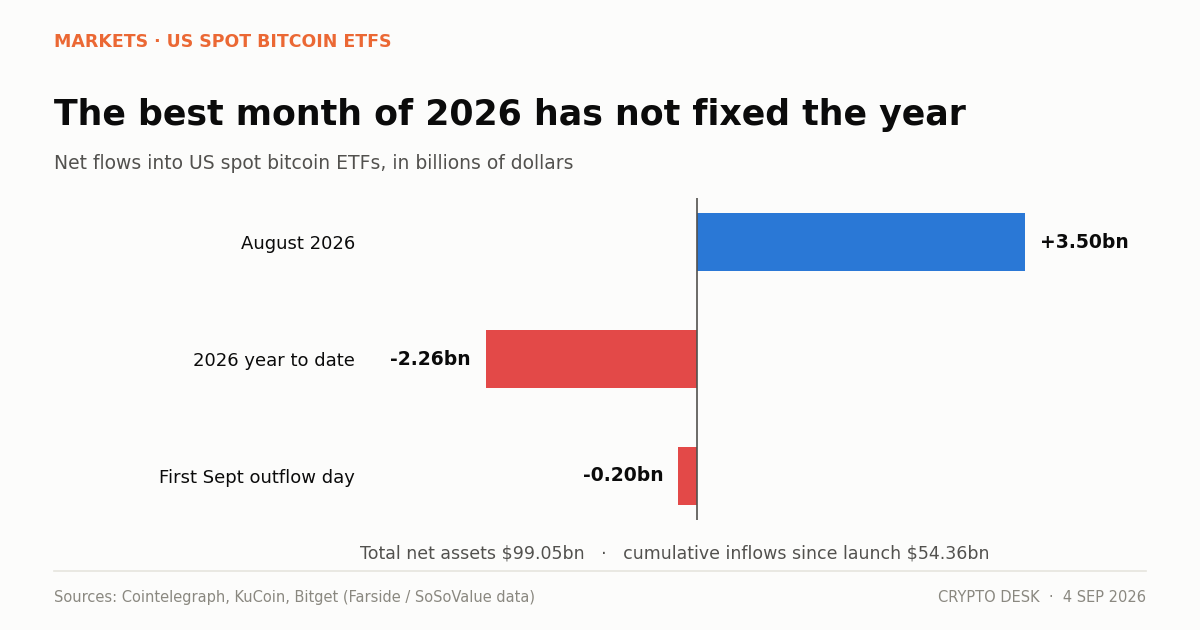
Bitcoin ETF inflows reached roughly $3.5 billion in August 2026, the strongest month since October 2025, before September opened with a $201.8 million redemption day.
On this page
- The August numbers
- Ether funds did something arguably more impressive
- Sentiment moved less than the flows
- Why the September outflow is not automatically bad news
- What the flow data is actually good for
- The altcoin ETF layer
- What to watch
- One month against one year
- A note on how these numbers are compiled
US spot bitcoin ETFs took in roughly $3.5 billion in net new money during August 2026. That is the strongest month the products have had since October 2025, and it arrived in a year that had otherwise been defined by redemptions.
Then the first week of September brought a single-day net outflow of about $201.8 million, ending a seven-session run of inflows.
Both facts are true. Which one matters more depends on what happens over the next fortnight.
The August numbers
By 25 August the funds had gathered $3.03 billion for the month, with a $314.37 million inflow on the Tuesday marking a seventh consecutive positive session. The month closed near $3.5 billion.
Some context for that figure:
| Metric | Value |
|---|---|
| August 2026 net inflows | ~$3.5bn |
| Total net assets | $99.05bn |
| Cumulative net inflows since launch | $54.36bn |
| 2026 year-to-date net flows | -$2.26bn |
| Best prior month | October 2025 |
The year-to-date line is the one that reframes everything. Even after the best month in ten months, US spot bitcoin ETFs remain net negative for 2026 by $2.26 billion. August cut that deficit by more than half. It did not erase it.
Bitcoin itself rose about 25% over the month, briefly trading above $80,000 before settling near $78,880 by late August. Both the price move and the flow move are real, and they reinforced each other, which is how these things usually work.
Ether funds did something arguably more impressive
Spot ether ETFs ran an eleven-day streak of net inflows through the end of August. A single Tuesday in that run brought $179.8 million, and the seven-day total came to roughly $1 billion. Ether ETF assets reached approximately $15.6 billion.
Ether's monthly price gain of 31.2% outpaced bitcoin's. For a product set that spent most of its first eighteen months struggling to attract attention, an eleven-session inflow streak represents a genuine change in behaviour, not a rounding error.
Sentiment moved less than the flows
The Crypto Fear & Greed Index fell to 65 from 74 during the late-August stretch, staying inside "Greed" territory but drifting toward neutral.
That divergence is worth noting. Money was arriving while sentiment cooled. In previous cycles the two moved together, with retail enthusiasm and fund flows peaking within days of each other. A flow profile that holds up while sentiment softens suggests the buyer is less reactive than the retail crowd, which is roughly what you would expect if the marginal buyer is an advisor rebalancing a model portfolio, not someone reading a chart.
Why the September outflow is not automatically bad news
A $201.8 million net redemption is about two-thirds of one strong inflow day. It ended a streak, which makes it a headline, but the magnitude is unremarkable.
Three explanations are all plausible, and the data cannot yet distinguish between them.
Month-end rebalancing. Funds and model portfolios rebalance on a calendar. A position that ran up 25% in a month gets trimmed back to target weight mechanically, with no view on the asset expressed at all.
Geopolitical de-risking. The renewed US-Iran exchange pushed oil to a three-month high in early September and pressured risk assets broadly. Bitcoin fell to $76,597 on 2 September. Some redemptions likely reflect the same defensive positioning visible across equities.
Genuine reversal. August's inflows may simply have exhausted the buyers who wanted exposure at these levels.
The distinguishing test is duration. One outflow day is noise. Five consecutive outflow days with bitcoin holding steady would suggest rebalancing. Five consecutive outflow days with bitcoin falling would suggest something worse.
What the flow data is actually good for
ETF flow numbers have become the most useful high-frequency indicator in this market, and it is worth being precise about why.
They are published daily, per fund, with no lag beyond one session. They cannot be faked, because they reflect share creation and redemption at authorised participants. And they capture a buyer segment — registered investment advisors, wealth platforms, institutional allocators — that has no other visible footprint. Exchange volumes tell you about traders. Flows tell you about allocators.
The limitation is that they say nothing about the rest of the market. Spot ETFs hold roughly $99 billion of a market capitalisation several times that. Flows are a signal about one important buyer, not a census of demand.
The altcoin ETF layer
August was also the month the non-bitcoin, non-ether products became material.
Solana ETFs approached $1.5 billion in combined assets, with roughly $1.3 billion of cumulative inflows and over $170 million arriving in August alone. XRP products entered September near $1.5 billion in total assets, one fund alone passing $500 million, with August inflows above $150 million and a peak week of about $110 million between 24 and 28 August.
Those are not bitcoin-scale numbers. They are, however, real money in products that did not exist in usable form a year ago, and they change the shape of what "crypto ETF flows" means as a category.
What to watch
Daily net flow, per product. Published each trading session. The direction over a rolling five days matters more than any single print.
Whether ether's streak resumes. Eleven consecutive days was the standout statistic of August. Whether the ether products can rebuild that pattern in September is a cleaner test of allocator conviction than bitcoin's numbers, because ether has less momentum-chasing money in it.
The 15 September CLARITY Act cloture vote. A market-structure statute would change the risk calculus for institutions that currently size crypto allocations conservatively because of regulatory uncertainty. Failure would not reverse flows on its own, but it removes a catalyst.
One month against one year
One strong month does not undo a year of redemptions, and the year-to-date figure is still negative. One outflow day does not undo the strong month either.
What August demonstrated is that demand through regulated wrappers is responsive rather than dead — it comes back when price does. Whether it stays through a geopolitical shock and a contested legislative vote is the question September will answer.
A note on how these numbers are compiled
Daily ETF flow figures come from two main trackers, Farside Investors and SoSoValue, both of which derive them from each fund's published share creation and redemption activity. The methodology is sound but the timing is not instantaneous: figures are frequently revised a day later as fund administrators finalise the numbers.
This has a practical consequence. A single-day figure reported in the afternoon is provisional, and revisions of ten to twenty percent on a given day are ordinary. It is why the five-day rolling direction is a more reliable read than any individual session, and why headlines built on one day's number sometimes look wrong a week later.
Cumulative figures — the $54.36 billion since launch, the $99.05 billion in net assets — are far more stable, because revisions wash out over hundreds of sessions. Where a number in this article is a single day's print, treat it as approximately right instead of exactly right.
About this report. Flow figures are drawn from Cointelegraph's daily ETF coverage of Farside Investors and SoSoValue data, and from KuCoin's month-end summary. Altcoin ETF asset figures come from the Bitcoin Foundation's September ETF review. Daily flow data is revised; treat single-day figures as provisional.
Not investment advice. Fund flows describe past behaviour and do not forecast returns.
Frequently asked questions
How much did bitcoin ETFs take in during August 2026?
US spot bitcoin ETFs gathered roughly $3.5 billion, their best month since October 2025. Total net assets reached $99.05 billion and cumulative inflows since launch stood at $54.36 billion.
Are bitcoin ETFs positive for 2026 overall?
No. Even after August, year-to-date net flows remained negative at about $2.26 billion. August cut the deficit by more than half but did not erase it.
Why did ether ETFs outperform in August?
Spot ether ETFs ran an eleven-day streak of net inflows, reaching roughly $15.6 billion in assets, while ether's price gained 31.2% on the month against bitcoin's 25%.
Sources
- Spot Bitcoin ETFs Add $314M as August Inflows Top $3B — Cointelegraph
- Bitcoin ETFs Post $3.52B August Inflows as BTC Jumps 25% — Cointelegraph
- Bitcoin ETFs Record Strongest Month of 2026 in August, Face Outflows in September — KuCoin
- Bitcoin ETF inflows end streak with $201.8 million outflow — Bitget News
- Crypto ETFs Enter a New Phase in September — Bitcoin Foundation
Read next
- Sentiment Has Fallen for Three Sessions While Price Did Nothing. That Is the Momentum Draining Out. The crypto Fear and Greed Index slipped to 66 from 69 and 71 across three sessions while bitcoin barely moved…
- Stablecoins Turned Over $76 Billion in a Day on a $291 Billion Base The stablecoin market cap sits at $291.3 billion with $76.11 billion of daily volume — a turnover ratio no ot…
- IBIT Took $117 Million on a Friday Nobody Was Watching IBIT inflows of over $117 million on Friday extended a bitcoin ETF run of three consecutive positive weeks an…