Bitcoin Slips Under $77,000 as Iran Strikes Pull Risk Assets Down
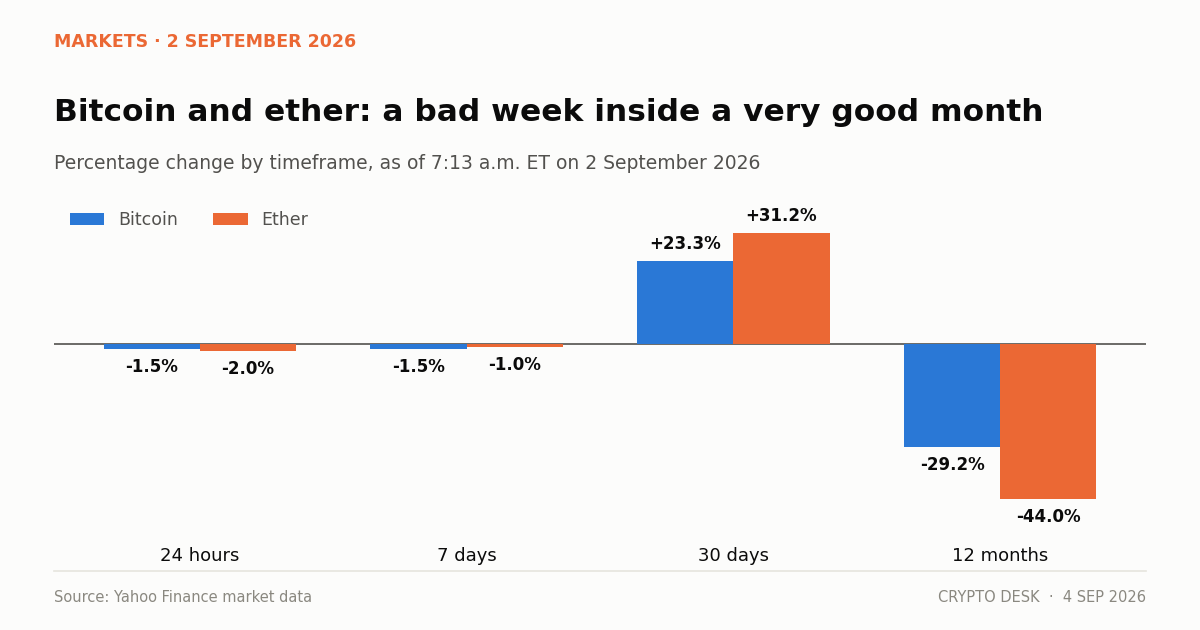
The bitcoin price today stands at $76,597, down 1.5% on the session but up 23.3% over a month, after US strikes on Iran lifted oil and revived rate-hike fears.
On this page
- What actually triggered the selling
- The numbers behind the headline number
- Why August was strong in the first place
- The oil correlation nobody wants
- What we do not know yet
- Bitcoin price today: what to watch this week
- The wider context
- One more figure worth carrying around
Bitcoin opened Wednesday 2 September at $77,395.89 and was changing hands at $76,597.13 by 7:13 a.m. Eastern, a drop of about 1.5% on the day. Ether did slightly worse, falling 2% from $2,417.66 to $2,373.76 over the same stretch.
Neither move is dramatic on its own. What makes them worth a second look is the reason behind them, and the fact that both assets are still sitting on very large monthly gains that the market now has to defend.
What actually triggered the selling
US airstrikes on Iranian targets, followed by Iranian retaliation using rockets and drones, put a fresh geopolitical premium into oil during the first days of September. Oil pushed to a three-month high. That is the whole chain of causation, and it runs through inflation rather than through anything crypto-specific.
Higher energy prices feed into headline inflation. Higher inflation makes it harder for the Federal Reserve to cut, and easier for the hawks on the committee to argue for holding or raising. Assets that pay no yield — bitcoin and ether among them — get repriced when the expected path of rates moves up, because the opportunity cost of holding them rises.
There is a Fed meeting later this month. Traders are positioning ahead of it, and a war-driven oil spike is exactly the kind of input that makes that positioning defensive.
The numbers behind the headline number
A single day's percentage change tells you almost nothing. The four timeframes together tell you a great deal.
Bitcoin, as of 2 September:
| Timeframe | Change |
|---|---|
| 24 hours | -1.5% |
| 7 days | -1.5% |
| 30 days | +23.3% |
| 12 months | -29.2% |
Ether, same timestamp:
| Timeframe | Change |
|---|---|
| 24 hours | -2.0% |
| 7 days | -1.0% |
| 30 days | +31.2% |
| 12 months | -44.0% |
Read those columns from right to left and you get the real story. Both assets are deep in the red over a year. Both had a very strong August. This week has taken back a sliver of August, and nothing more.
Bitcoin's record close remains $126,198.07, set on 6 October 2025. At $76,597 the asset trades roughly 39% below that mark. Ether peaked at $4,953.73 on 24 August 2025 and is now about 52% below its own high.
That gap matters for interpretation. When an asset is 39% off its high and up 23% in a month, a 1.5% daily decline is noise inside a recovery, not the start of a new leg down. It becomes something else only if the monthly gain starts giving way.
Why August was strong in the first place
The rally that produced those +23% and +31% monthly figures was not driven by retail enthusiasm. It was driven by fund flows.
US spot bitcoin ETFs pulled in roughly $3.5 billion during August, their best month since October 2025. Ether products ran an eleven-day streak of positive net flows. Solana and XRP funds each ended August with assets approaching $1.5 billion. Money was arriving through regulated wrappers, steadily, on most trading days.
The problem with flow-driven rallies is that they are only as durable as the flows. Bitcoin ETFs broke their streak in early September with a single-day net outflow of about $201.8 million. One day is not a trend. But it is the mechanism to watch, because it is the mechanism that produced the gain.
The oil correlation nobody wants
Crypto's relationship with oil is not stable, and anyone who tells you otherwise is selling something. For most of the last two years the two have moved independently. In the specific case of a supply-side energy shock, though, the transmission runs cleanly: oil up, inflation expectations up, real rates up, long-duration risk assets down. Bitcoin has traded as a long-duration risk asset for the better part of three years, whatever the monetary-hedge argument says it should do.
This is the uncomfortable part of the current setup for bitcoin maximalists. A conflict that disrupts energy supply is precisely the sort of macro event bitcoin is supposed to hedge. In practice it has traded down. The gold comparison keeps failing at exactly these moments, and it has failed again.
What we do not know yet
Three things are genuinely unresolved, and it would be dishonest to pretend otherwise.
How long the escalation lasts. A short exchange that de-escalates within days leaves almost no mark on prices. A sustained campaign that threatens shipping through the Strait of Hormuz is a different scenario entirely, and oil is the variable that would tell you first.
What the Fed does. The meeting later this month is the next scheduled catalyst. An oil-driven inflation print landing before it would narrow the committee's options considerably.
Whether ETF flows resume. The single September outflow day could be a rebalancing artefact or the beginning of a reversal. Two or three more sessions of the same would change the read materially.
Bitcoin price today: what to watch this week
For bitcoin, the level worth marking is $80,000. Price traded briefly above it in late August before the pullback. Reclaiming and holding it would suggest the August flow story is intact. Losing $75,000 with ETFs still bleeding would suggest it is not.
For ether, the $2,300 area is the equivalent marker. It sits just below current price and above the range that held during the summer.
For everyone, the daily ETF flow numbers are more informative than the price itself. They are published each trading day, they are unambiguous, and in this cycle they have led price more often than they have followed it.
The wider context
It is worth keeping the twelve-month numbers in view when reading any single week. Bitcoin is down 29% year over year. Ether is down 44%. That is a genuine bear market by any conventional definition, and August's rally, strong as it was, has not reversed it.
Recoveries from drawdowns of that size are rarely smooth, and they are rarely fast. They typically involve several sharp rallies that get partially retraced, which is a reasonable description of what has happened over the past five weeks. Nothing in the current data set requires a more dramatic interpretation than that.
One more figure worth carrying around
Bitcoin's 30-day gain of 23.3% and its 12-month loss of 29.2% imply something specific: almost the entire annual decline happened before August. Strip out the last five weeks and the twelve-month figure would sit closer to -43%.
That is the shape of a market that fell hard, stopped falling, and has begun to retrace. It is not the shape of a market still in free fall, and it is not the shape of one that has recovered. Recoveries of this type typically produce several sharp advances separated by retracements of a third to a half of each move, which is a reasonable prior for what the next few weeks look like if the August pattern holds.
The retracement so far is 1.5% against a 23.3% advance. On that arithmetic the current pullback is small — roughly a sixteenth of the gain. It becomes structurally interesting only if it reaches the $70,000 to $72,000 area, which would give back around half of August.
About this report. Prices cited are from Yahoo Finance market data at 7:13 a.m. ET on 2 September 2026. All-time-high figures reference closing prices on the dates noted. ETF flow data is from Cointelegraph's daily coverage of Farside and SoSoValue figures. Figures move; check live quotes before acting on anything here.
Not investment advice. This article is journalism, not a recommendation. Digital assets are volatile and you can lose your entire position.
Sources
- Bitcoin and ethereum prices today, Wednesday, September 2, 2026 — Yahoo Finance
- Bitcoin ETFs Post $3.52B August Inflows as BTC Jumps 25% — Cointelegraph
- Live updates: Bitcoin slumps as oil surges to three-month high on new Iran strikes — CoinDesk
Read next
- Sentiment Has Fallen for Three Sessions While Price Did Nothing. That Is the Momentum Draining Out. The crypto Fear and Greed Index slipped to 66 from 69 and 71 across three sessions while bitcoin barely moved…
- Stablecoins Turned Over $76 Billion in a Day on a $291 Billion Base The stablecoin market cap sits at $291.3 billion with $76.11 billion of daily volume — a turnover ratio no ot…
- IBIT Took $117 Million on a Friday Nobody Was Watching IBIT inflows of over $117 million on Friday extended a bitcoin ETF run of three consecutive positive weeks an…