Bitcoin Now Tracks Gold More Closely Than Tech Stocks for the First Time Since 2020
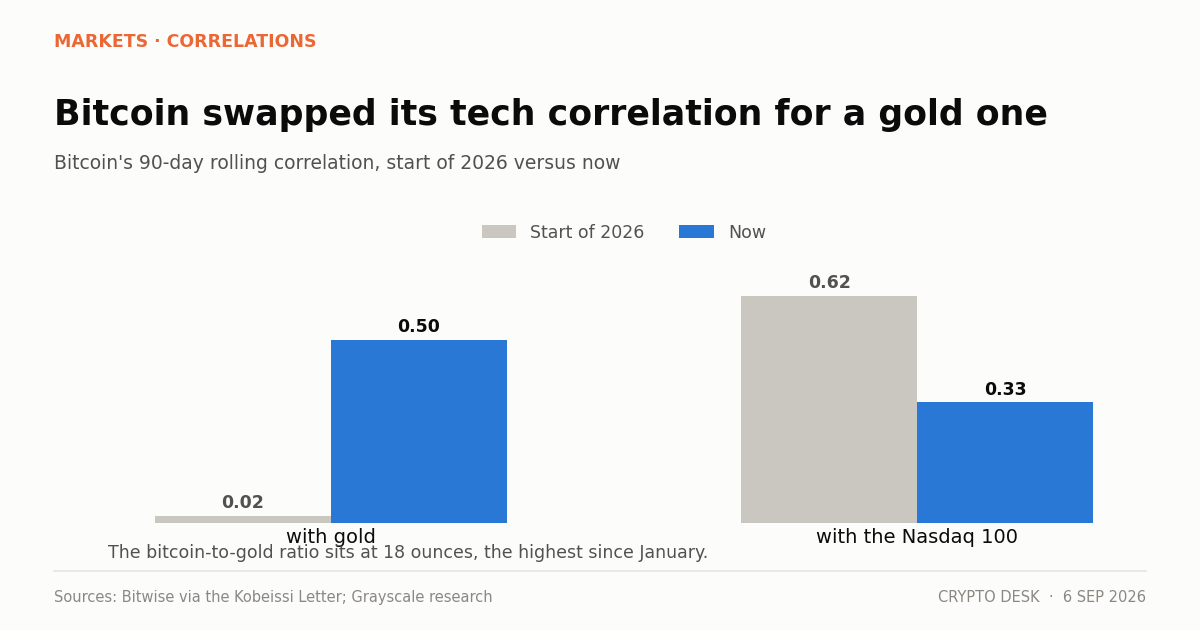
The bitcoin gold correlation has risen above 0.50 on a 90-day rolling basis, a six-year high, while bitcoin's Nasdaq 100 correlation has fallen from over 60% to roughly 33%.
On this page
- The numbers and where they come from
- What a correlation of 0.50 does and does not mean
- The driver
- The complications
- Why it matters if it holds
- The flow evidence, such as it is
- What to watch
- The summary
- A note on how to check this yourself
Bitcoin's 90-day rolling correlation with gold has climbed above 0.50 — its highest reading since the 2020 pandemic period. Over the same stretch its correlation with the Nasdaq 100 has fallen from above 60% to roughly 30-33%, a one-year low.
For three years the standard description of bitcoin was "leveraged Nasdaq." That description is currently wrong, and if it stays wrong the entire framework for analysing the asset changes.
The numbers and where they come from
Grayscale's head of research, Zach Pandl, reported that the bitcoin-gold correlation has climbed from near zero at the start of 2026 to over 50%. The Kobeissi Letter, citing Bitwise Asset Management analysis of Bloomberg data, tracked the same move to around +0.50.
The Nasdaq figure moved the other way over the same 90-day window: from above 60% to the low thirties.
A third data point supports the shift. The bitcoin-to-gold ratio — how many ounces one bitcoin buys — sits at 18, its highest since January.
What a correlation of 0.50 does and does not mean
Some precision is warranted here, because correlation gets over-read constantly.
A 90-day correlation of +0.50 means that over the past quarter, roughly half the variance in bitcoin's daily returns moved in the same direction as gold's. It does not mean bitcoin is now a gold substitute, that the two will move together tomorrow, or that the relationship is causal.
Correlations between asset classes are unstable by nature. They rise during periods when one shared driver dominates and fall when it does not. The current shared driver is reasonably identifiable, which is what makes this particular move worth reading instead of dismissing.
The driver
US sovereign debt has passed $40 trillion. The 30-year Treasury yield reached 5.26%, a cycle high, with the 10-year at 4.788% and the five-year at 4.5%.
That combination — a rising debt stock and rising long-end yields — is the textbook setup for demand in assets held as protection against currency debasement. Gold is the incumbent in that trade. Bitcoin has claimed the position for a decade with mixed empirical support.
When both assets rally on the same fiscal news and sell on the same relief, a correlation of 0.50 is what you get. The mid-August episode illustrates the mechanism: the US Treasury announced a doubling of liquidity-support buybacks from $2 billion to $4 billion, and bitcoin ran from under $65,000 to over $80,000 within days.
The complications
Three, and none of them is small.
Gold has been falling. Gold reached $4,700 an ounce in August and was rejected, giving up a large part of its gains since. A correlation of 0.50 with a declining asset is not a bullish signal — it means bitcoin has been participating in gold's decline as well as its advance.
Bitcoin failed the actual test. Two days into September, US strikes on Iranian targets pushed Brent above $98. That is a textbook inflation and geopolitical shock — precisely the scenario a debasement hedge should handle. Bitcoin fell to $76,229. Whatever the correlation coefficient says, the behavioural evidence from the one live test this month is unflattering.
The sample is short. A 90-day window covers one quarter. Correlations that establish over a quarter routinely dissolve over the next one, and this particular relationship has flipped several times since 2020.
Why it matters if it holds
The practical consequence is about portfolio construction, not narrative.
An asset correlated to the Nasdaq is a risk asset. It gets sized against an investor's equity exposure, it belongs in the growth sleeve, and it gets cut when equity risk is reduced. That is where bitcoin has sat in most institutional allocation models since 2022.
An asset correlated to gold is a store-of-value allocation. It gets sized against real assets, it belongs in the inflation-protection or alternatives sleeve, and it survives equity de-risking. That is a different pool of capital with a longer holding period and lower turnover.
Institutions do not reclassify assets on a quarter of correlation data. They do reclassify on two or three years of it. The current reading is the beginning of a case rather than the case itself.
The flow evidence, such as it is
US spot bitcoin ETFs now hold $103 billion in assets, with $3.8 billion of net inflows over the trailing three weeks and roughly $3.5 billion in August — the strongest month since October 2025.
Notably, the largest single day of the period — $731 million on 3 September, of which about $454 million went to BlackRock's IBIT — followed dovish comments from Fed Governor Christopher Waller instead of any debasement narrative. Rate expectations still move this money.
Which suggests the correlation shift is not yet reflected in the behaviour of the buyers. They are trading a rates asset. The correlation says gold. Those two things have to reconcile eventually, and it is not obvious which one gives.
What to watch
Whether 0.50 holds through a full quarter. A reading that decays back toward zero over the next 90 days was a flow artefact, not a regime change.
How bitcoin behaves at the next fiscal event. A debt ceiling episode, a downgrade, or a failed auction would be a cleaner test than an oil shock.
Gold's own direction. A correlation with a rising gold price and a correlation with a falling one carry entirely different implications, and gold's rejection at $4,700 makes the current reading ambiguous.
The 16 September Fed decision. If bitcoin trades primarily on the dot plot, not on real yields, the rates framework is still the operative one regardless of what the correlation table says.
The summary
Bitcoin's relationship with gold is the closest it has been in six years and its relationship with tech stocks the weakest in one. That is a real, measured change in a market with $40 trillion of sovereign debt behind it.
It is also one quarter of data, on an asset that fell when a genuine geopolitical shock arrived, whose largest buyers still move on Fed commentary. Worth watching. Not yet worth rebuilding a thesis on.
A note on how to check this yourself
Correlation claims are unusually easy to verify, and unusually often reported without the parameters that determine them.
Three choices change the answer materially. The window — a 30-day correlation and a 250-day correlation on the same two assets routinely have opposite signs. The return frequency — daily returns produce different readings from weekly ones, because crypto trades on weekends and equities do not, introducing artefacts. And the method — Pearson correlation on raw returns behaves differently from rank correlation, particularly when one asset has fat tails, which bitcoin does.
The figures cited here are 90-day rolling correlations on daily returns, which is the market standard and is what makes them comparable to the historical readings they are being compared against.
Anyone quoting a correlation without stating the window is quoting a number that cannot be evaluated. It is worth asking.
About this report. Correlation figures are from Bitwise Asset Management analysis of Bloomberg data via the Kobeissi Letter, and from Grayscale head of research Zach Pandl, as reported by CryptoPotato and CoinTurk. Yield, debt and commodity levels are from the Bitcoin News Digest of 6 September 2026. Correlation windows are 90-day rolling unless stated.
Not investment advice. Correlations are historical measurements and change without warning.
Related reading
- Fed Hike Odds Pass 60% and Bitcoin Holds $78,900
- Bitcoin $82,000 Resistance: Three Rejections in Two Weeks
- Bitcoin Dominance at 56.9% Leaves Altcoins 32% of the Market
- Crypto Fear and Greed Index Falls to 66 on a Flat Tape
Sources
- Bitcoin's Link to Gold Hits a 6-Year High as Tech Correlation Fades — CryptoPotato
- Bitcoin-gold correlation rises to +0.50 while Nasdaq link hits 1-year low — CoinTurk
- Bitcoin Gold Correlation Climbs to 0.50 as Nasdaq Link Hits Yearly Low — Blockonomi
- Bitcoin News Digest, September 6, 2026 — Mike Richardson
Read next
- Sentiment Has Fallen for Three Sessions While Price Did Nothing. That Is the Momentum Draining Out. The crypto Fear and Greed Index slipped to 66 from 69 and 71 across three sessions while bitcoin barely moved…
- Stablecoins Turned Over $76 Billion in a Day on a $291 Billion Base The stablecoin market cap sits at $291.3 billion with $76.11 billion of daily volume — a turnover ratio no ot…
- IBIT Took $117 Million on a Friday Nobody Was Watching IBIT inflows of over $117 million on Friday extended a bitcoin ETF run of three consecutive positive weeks an…