$103 Billion in Assets, and the Daily Flow Swung by a Billion Dollars in Three Sessions
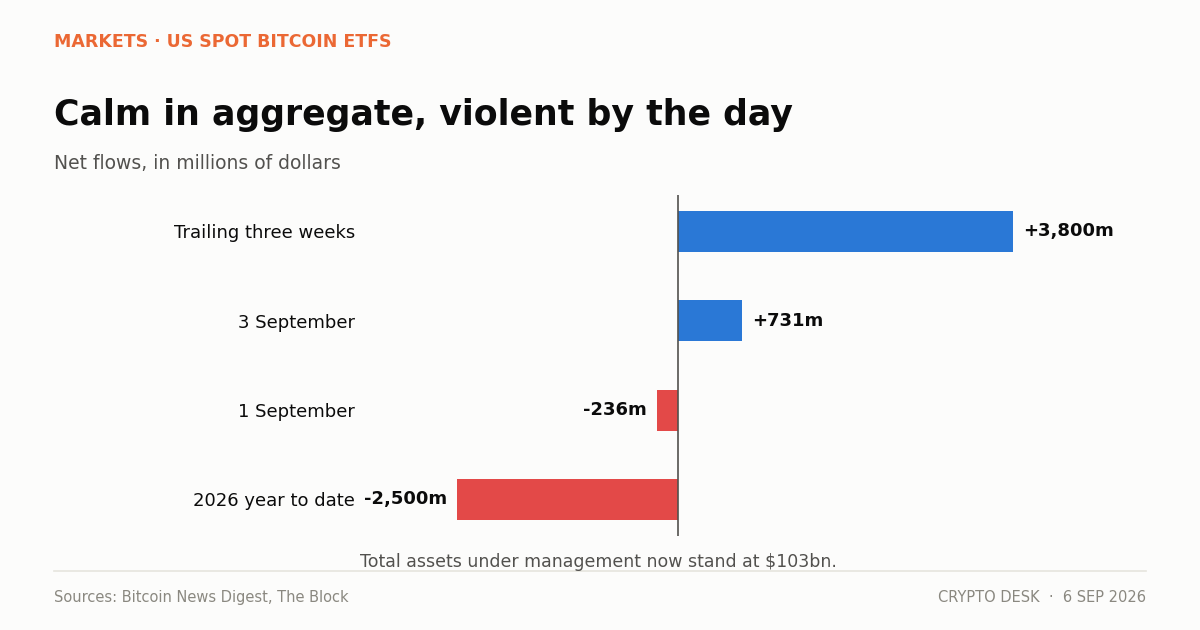
Bitcoin ETF assets under management now stand at $103 billion after $3.8 billion of inflows over three weeks, but the daily figures inside that calm aggregate swung by $967 million in three sessions.
Bitcoin ETF assets under management: the ledger
| Period | Net flow |
|---|---|
| 1 September (one day) | -$236.46m |
| 3 September (one day) | +$731m |
| Trailing three weeks | +$3.8bn |
| August 2026 | ~+$3.5bn |
| Total assets under management | $103bn |
August was the strongest month since October 2025. Three weeks of $3.8 billion is a genuine accumulation run by any standard.
And the year-to-date position remains roughly $2.5 billion below where it started, despite all of it. That figure is the one that keeps disappearing from coverage, and it is the one that puts the rest in proportion.
What actually caused the swing
Neither day had anything to do with bitcoin's fundamentals.
The 1 September outflow followed US strikes on Iranian targets that pushed Brent crude above $98 and sent risk assets lower across the board. Bitcoin fell to $76,229 the next day.
The 3 September inflow followed Fed Governor Christopher Waller signalling support for holding rates if inflation continues cooling, which cut September hike odds from about 63% toward 50%. Bitcoin ran to $82,281 in a squeeze that liquidated between $318 million and $510 million of positions. Roughly $454 million of the day's $731 million went to BlackRock's IBIT.
Then August payrolls printed 162,000 against a consensus near 55,000, hike odds moved back up, and bitcoin closed the week at $77,024 — below its 50-week moving average of $80,300.
Two macro events, opposite directions, a billion-dollar swing in fund flows, and a weekly close essentially where the week started.
The concentration signal
The IBIT share of the big inflow day is the detail worth extracting. At roughly 62% of the total, with six other funds taking the remainder, it points to a specific kind of buyer.
Rachael Lucas of BTC Markets described the mechanism: "The concentration in IBIT is the tell. That is the wrapper institutions use for size, which points to allocation flow instead of tactical positioning."
The reasoning holds. A trader has options — futures, offshore perpetuals, spot, whichever ETF has the tightest spread that morning. An institution making an allocation routes to the largest, deepest product, because execution size matters more than a basis point of fee. Concentration in the biggest wrapper is what committee decisions look like in the flow data.
That reading sits awkwardly against the fact that the trigger was a single Fed governor's remarks. Allocation decisions are not usually made on an afternoon's news. Both things are in the data, and they do not fully reconcile.
How to use flow data without being misled
Three properties of these numbers are worth knowing, because they get reported with more precision than they carry.
They are revised. Trackers derive them from fund share creation and redemption activity, and administrators finalise figures a day or more later. Single-day revisions of ten to twenty percent are ordinary.
They are net. A $731 million inflow means creations exceeded redemptions by that much. Gross activity in both directions is considerably larger, and the net figure hides how much two-way flow produced it.
They measure one buyer. $103 billion is a large but minority share of bitcoin's float. Flows describe allocators using regulated wrappers. They say nothing about direct holders, offshore venues, or the corporate treasuries that were also buying this week — Strategy added 4,603 BTC, Strive is adding 2,700.
The practical consequence is that the rolling five-day direction carries information and the single-day print mostly does not.
What $103 billion actually represents
Two and a half years after launch, the spot ETF complex holds assets comparable to a mid-sized asset manager's entire flagship franchise. It did that in a period when bitcoin fell roughly 27% over twelve months and 39% from its October 2025 record of $126,198.07.
That is what the number actually shows. The products gathered $103 billion through a drawdown, not through a bull run. Assets accumulated in a falling market belong to holders with a longer horizon than assets accumulated at a top, because the people who bought the top have already left.
Whether that translates into stability is untested. The complex has not been through a full cycle.
What to watch
The year-to-date figure crossing zero. At roughly $2.5 billion below baseline, three more months like August would flip it. That would be the genuine milestone, and it has not happened.
Whether flows hold through 15–18 September. The Senate CLARITY Act cloture vote on the 15th, the Fed decision and dot plot on the 16th, and quadruple witching on the 18th land in four days. Allocators buying into a risk window is a different signal from allocators waiting for it to clear.
IBIT's share. Sustained concentration supports the allocation reading. A shift toward even distribution suggests tactical money.
Assets versus flows. AUM rises on both inflows and price appreciation. Separating the two is the only way to know which is doing the work.
What two and a half years of data now supports
Enough history has accumulated for one conclusion that was not available at launch: ETF flows in this market lead price more often than they follow it.
The mechanism is straightforward. Fund creations require an authorised participant to source bitcoin, which means real spot buying, not a derivative position. That buying hits the same order books everyone else trades on, and at $731 million in a session it is not a marginal contribution.
The limitation is equally clear. The relationship is neither reliable nor tradeable on a single day, because the flow is published after the session it describes. By the time a $731 million day is reported, the price has already moved.
Where it does help is over rolling weeks. A sequence of inflow days with price making lower highs, or outflow days with price holding, is a divergence worth noticing — it means one identifiable group of buyers is doing the opposite of what the tape suggests.
That divergence is not present right now. Flows and price moved together all week, in both directions.
Two and a half years, one missing test
The complex has gathered $103 billion. It has not yet been through a sustained period of net redemptions.
The 2026 year-to-date figure of roughly -$2.5 billion is the closest thing to one, and it accumulated gradually across many small outflow days rather than through a concentrated exit. How these products behave when a large allocator decides to leave at size, and how the redemption mechanism handles it, is genuinely untested.
That is not a prediction of trouble. It is an acknowledgment that the resilience everyone assumes has not been demonstrated.
About this report. Flow figures, assets under management and the three-week total are from the Bitcoin News Digest of 6 September 2026. The IBIT breakdown and analyst quote are from The Block's reporting of 3 September data. Price levels, liquidations and the weekly close are from the same digest. Daily flow figures are provisional and subject to revision.
Not investment advice. Fund flows describe past behaviour and do not forecast returns.
Frequently asked questions
How much is held in bitcoin ETFs?
US spot bitcoin ETFs hold $103 billion in assets, following $3.8 billion of net inflows over the trailing three weeks and roughly $3.5 billion in August — the strongest month since October 2025.
Are bitcoin ETF flows positive for 2026?
No. The year-to-date position remains roughly $2.5 billion below where it started, despite the strong recent run. Three more months like August would flip it, which has not yet happened.
Related reading
- IBIT Inflows Reach $117M as Bitcoin ETF Streak Extends
- XRP ETF Inflows Hit $1.68bn Across Eight Green Weeks
- ETFs vs Corporate Treasuries: Two Very Different Bids
- Zcash Price Up 38.5% in a Week as ZCSH ETF Draws Money
Sources
- Bitcoin News Digest, September 6, 2026 — Mike Richardson
- US bitcoin ETFs report the largest inflow day since January, worth $731 million — The Block
- September, Not October, May Test Crypto's Big 2026 Rally — DailyCoin
- Bitcoin ETFs Record Strongest Month of 2026 in August — KuCoin
Read next
- Sentiment Has Fallen for Three Sessions While Price Did Nothing. That Is the Momentum Draining Out. The crypto Fear and Greed Index slipped to 66 from 69 and 71 across three sessions while bitcoin barely moved…
- Stablecoins Turned Over $76 Billion in a Day on a $291 Billion Base The stablecoin market cap sits at $291.3 billion with $76.11 billion of daily volume — a turnover ratio no ot…
- IBIT Took $117 Million on a Friday Nobody Was Watching IBIT inflows of over $117 million on Friday extended a bitcoin ETF run of three consecutive positive weeks an…