DeFi Is a $78 Billion Sector That Lost $1.6 Billion to Attackers This Year
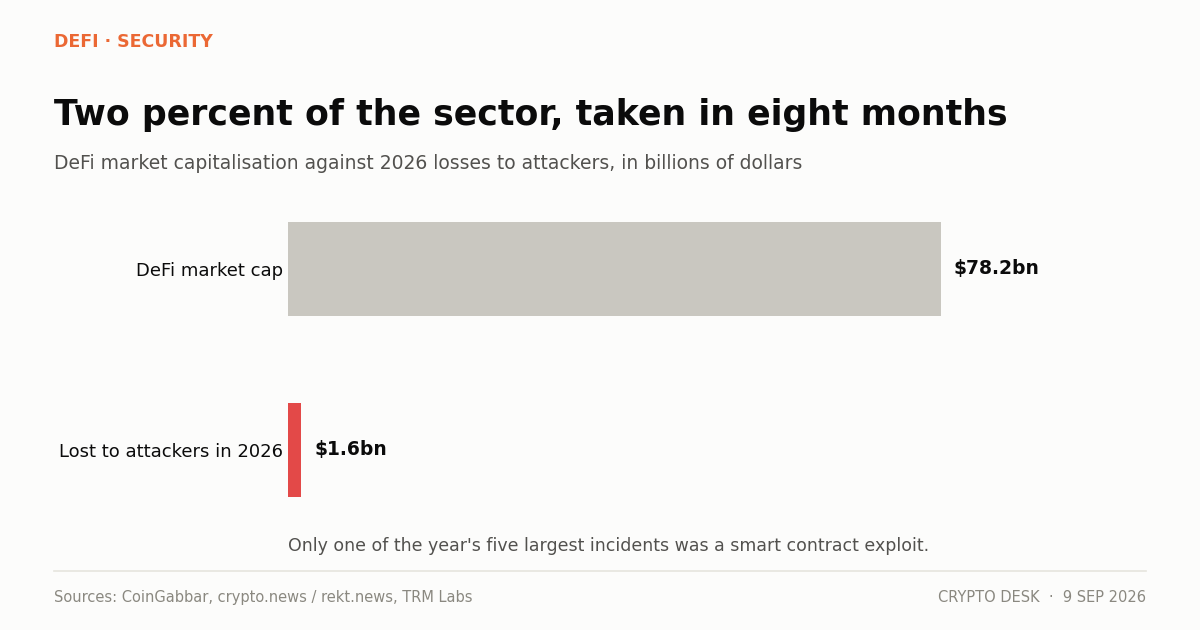
The DeFi market cap stands at $78.2 billion while attackers have taken roughly $1.6 billion in 2026 — about 2% of the sector's entire value in eight months.
On this page
- The loss ratio in context
- Where the losses came from
- The attribution problem
- What the ratio does to the sector's economics
- What would move the number
- What to watch
- What the ratio means for a user
The DeFi market capitalisation stands at $78.2 billion, down 0.1% on the day, on $10.4 billion of volume.
Attackers have taken at least $1.3 billion from DeFi protocols in the first eight months of 2026 across more than thirty exploits above $3 million. The Liquid Network incident on 6 September added roughly $319 million, of which $272 million came back.
Set the surviving loss against the sector's value and the ratio is roughly 2%.
The loss ratio in context
Two percent of sector value lost to theft in eight months is not a number that exists in regulated finance.
Card networks operate at fraud rates measured in basis points — fractions of one percent of transaction volume, not of total market value. Bank losses to external fraud are smaller still relative to assets. Insurance exists, is priced, and losses are absorbed as a cost of doing business.
DeFi has no equivalent absorption mechanism at scale. When a protocol loses $290 million, the users lose it unless the attacker chooses to return it or a governance body has emergency powers to claw it back.
Where the losses came from
| Incident | Amount | Method |
|---|---|---|
| Liquid Network | ~$319m (85% returned) | Range proof cache flaw |
| KelpDAO | $290m | Compromised developer session keys |
| Drift Protocol | $285m | Social engineering for admin key |
| Coldcard wallets | $130m | Firmware entropy bug |
| Tectonic (Cronos) | $120.4m | Token price manipulation |
Exactly one of those is a smart contract exploit, and even Tectonic used the protocol as written.
For the first time on record, compromised keys and credentials caused more DeFi losses in 2026 than smart contract vulnerabilities. A protocol can pass a flawless code audit and still lose nine figures, because the audit examines the contract and the attacker examines the operational layer around it.
The attribution problem
North Korea's Lazarus Group, operating as TraderTraitor, accounts for roughly 44% of 2026 losses, including $575 million from Drift and KelpDAO. Combined with the February 2025 Bybit theft, the group's eighteen-month total exceeds $2 billion.
That changes what the 2% represents. It is not a diffuse tax paid to opportunists. Close to half of it is a single state programme extracting value at a rate that would be treated as a national security matter in any other industry.
What the ratio does to the sector's economics
A protocol charging fees on activity has to price in an expected loss rate.
At 2% of sector value annually, with losses concentrated in the largest protocols because that is where the money is, the biggest platforms carry the highest expected loss. That is the opposite of how risk normally scales — in traditional finance, size buys better controls and lower relative losses.
It also explains why insurance has not solved this. On-chain cover protocols price against realised losses, and a 2% annual loss rate produces premiums that make many strategies uneconomic. The cover exists; demand for it at fair pricing does not.
What would move the number
Three changes, none of them a better audit.
Operational controls. Hardware-backed signing, quorum requirements for administrative actions, time delays on privileged operations, and rotation. Most protocols still have a small multisig held by people using ordinary laptops.
Supply chain scope. KelpDAO's $290 million came through compromised LayerZero session keys and poisoned RPC infrastructure the protocol did not own. Security review that stops at the contract boundary misses the entry point.
Loss absorption. Someone has to hold the risk. Protocol-owned insurance funds, capped exposure per collateral type and circuit breakers are all available, and all reduce headline TVL — which is why they are rarely implemented before an incident.
What to watch
Whether the 2026 total crosses $2 billion. Four months remain.
The Liquid post-mortem. Whether the range proof flaw generalises to other confidential systems.
Insurance pricing. A market estimate of protocol risk, published continuously.
Whether audit scope language changes. If firms begin explicitly covering operational security, the industry has accepted where the attack surface is.
What the ratio means for a user
For someone with money in a protocol, the sector-wide 2% is the wrong number. Losses are not distributed evenly.
They concentrate in bridges, in lending protocols accepting thin collateral, and in anything with a small multisig holding administrative keys. A user in a large, well-established protocol with time-delayed admin actions faces a materially lower expected loss than the sector average. A user in a new protocol with an anonymous team and a two-of-three multisig faces a materially higher one.
The practical implication is that due diligence should focus on the operational layer instead of the audit report. Who holds the keys, how many are required, whether privileged actions have time delays, and what the protocol depends on that it does not control.
None of that is in a marketing page, and most of it is checkable on-chain.
About this report. DeFi market capitalisation and volume are from CoinGabbar's 9 September 2026 summary. Loss totals, incident details and attribution are from crypto.news reporting of rekt.news data through August 2026, with Liquid figures from TRM Labs. The 2% ratio is this desk's calculation from those figures and is approximate, since market capitalisation and cumulative losses are measured differently.
Not investment or security advice. Consult a qualified professional for protocol design decisions.
Frequently asked questions
How big is DeFi right now?
The DeFi market capitalisation is $78.2 billion, down 0.1% on the day, on $10.4 billion of volume. Against that, attackers took at least $1.3 billion in the first eight months of 2026, with the Liquid Network incident adding roughly $319 million of which $272 million returned.
How does a 2% loss rate compare to traditional finance?
It does not exist there. Card networks operate at fraud rates measured in basis points of transaction volume, not percentages of total market value, and losses are insured and absorbed as a cost of business.
Which attack type causes the most losses now?
Compromised keys and credentials, which in 2026 overtook smart contract vulnerabilities for the first time on record. Of the five largest incidents this year, exactly one was a contract exploit — and even that used the protocol as written.
What would actually reduce the losses?
Operational controls, not better audits: hardware-backed signing, quorum requirements for admin actions, time delays on privileged operations, security review extending to bridges and RPC providers, and loss absorption through capped exposure and insurance funds.
Related reading
- Liquid Hack: 85% of Bitcoin Returned, $47M Kept as Bounty
- Elements Range Proof Bug: How 4,000 Fake L-BTC Was Minted
- White Hat Bounty Norms: Who Decides What a Hacker Keeps?
- Liquid Network Hack: $320M and 95% of BTC Reserves Gone
Sources
- DeFi has lost $1.3 billion to hacks in 2026 and the same attack keeps working — crypto.news
- 2026's Biggest Hack To Date: Attackers Drained $319 Million From Liquid Network — TRM Labs
- Crypto News September 9: Bitcoin Near $79K As BUN Token Surges 243K% — CoinGabbar
- DeFi Hacks 2026: $840M+ Lost and the Attack That Changed Everything — altFINS
Read next
- Uniswap's Revenue Nearly Tripled in a Day, and It Came from Robinhood's Chain Uniswap's daily protocol revenue rose from about $114,000 to $325,000 after fees switched on for Robinhood Ch…
- Ethena's Fee Switch Passed Unanimously. It Does Nothing Until USDe Nearly Doubles. Ethena's fee switch passed with 17m ENA in favour and zero against, but buybacks only start when USDe supply …
- Coinbase Wants to Be an Everything Exchange. Kraken Bought a Futures Broker. Binance Rented One. Crypto exchange bank charters and licences are diverging: Coinbase filed with FINRA, Kraken bought NinjaTrade…